Roku’s total streaming hours reached a record 145.6 billion in FY 2025, up 15% from 127.1 billion in 2024. Streaming hours serve as Roku’s primary engagement key performance metric (KPM) and are the foundational driver of its advertising inventory, subscription visibility, and platform monetization. This report provides a comprehensive breakdown of streaming hours data across annual totals, quarterly figures, per-account engagement, The Roku Channel’s growth, and the 2026 outlook.
Annual Streaming Hours (2017–2025)
Streaming hours on Roku have grown more than 10x over the past seven years, from approximately 14.8 billion in 2017 to 145.6 billion in 2025.
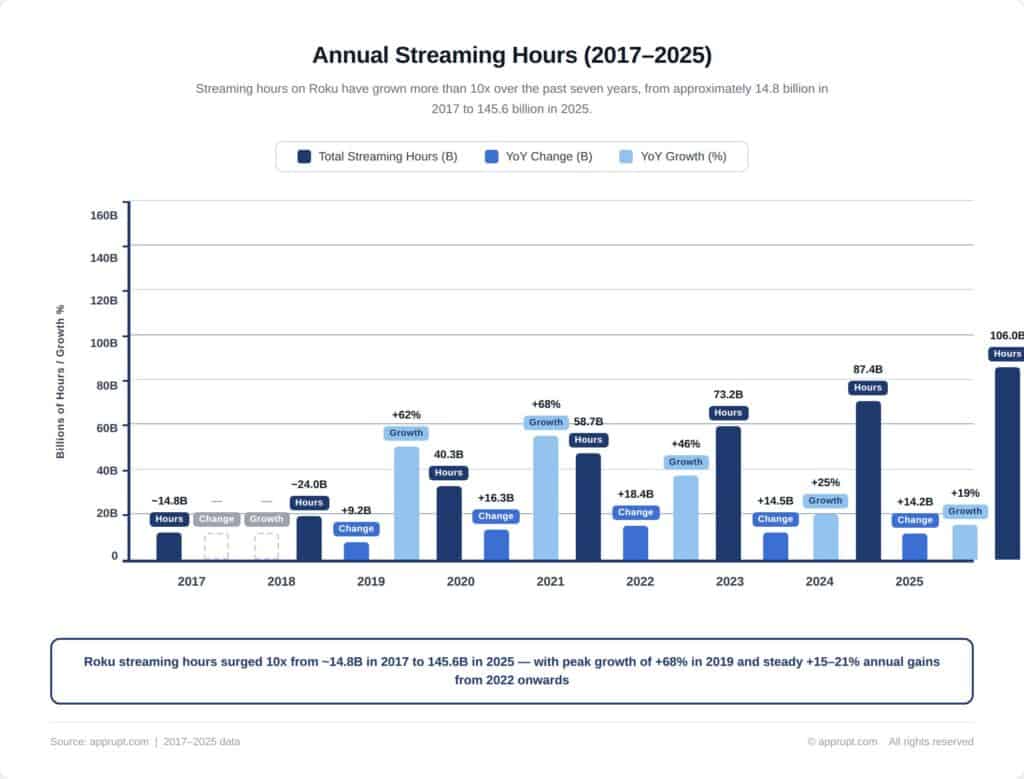
| Year | Total Streaming Hours | YoY Change | YoY Growth |
| 2017 | ~14.8B | — | — |
| 2018 | ~24.0B | +9.2B | +62% |
| 2019 | 40.3B | +16.3B | +68% |
| 2020 | 58.7B | +18.4B | +46% |
| 2021 | 73.2B | +14.5B | +25% |
| 2022 | 87.4B | +14.2B | +19% |
| 2023 | 106.0B | +18.6B | +21% |
| 2024 | 127.1B | +21.1B | +20% |
| 2025 | 145.6B | +18.5B | +15% |
The pandemic years (2020–2021) delivered an initial surge, with 2020 adding 18.4 billion hours as consumers shifted to home entertainment. Growth then moderated to 19–25% in 2021–2022 before re-accelerating to 20–21% in 2023–2024 as cord-cutting intensified and The Roku Channel gained traction. The 2025 growth rate of 15% reflects a maturing base—at 90 million+ households, each incremental percentage point represents substantially more absolute hours.
Quarterly Streaming Hours (2023–2025)
Quarterly data reveals seasonal patterns: Q4 consistently delivers the highest streaming hours, boosted by holiday viewing, while Q2 tends to be softer.
2023 Quarterly Breakdown
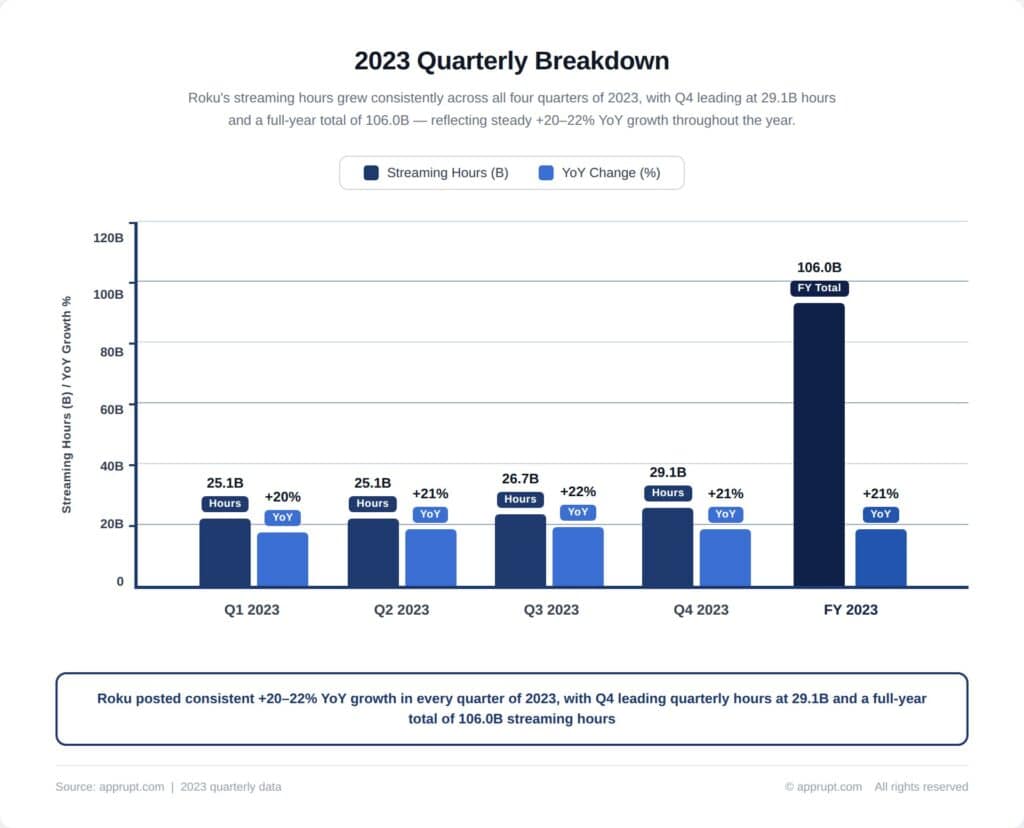
| Quarter | Streaming Hours | YoY Change |
| Q1 2023 | 25.1B | +20% |
| Q2 2023 | 25.1B | +21% |
| Q3 2023 | 26.7B | +22% |
| Q4 2023 | 29.1B | +21% |
| FY 2023 | 106.0B | +21% |
2024 Quarterly Breakdown
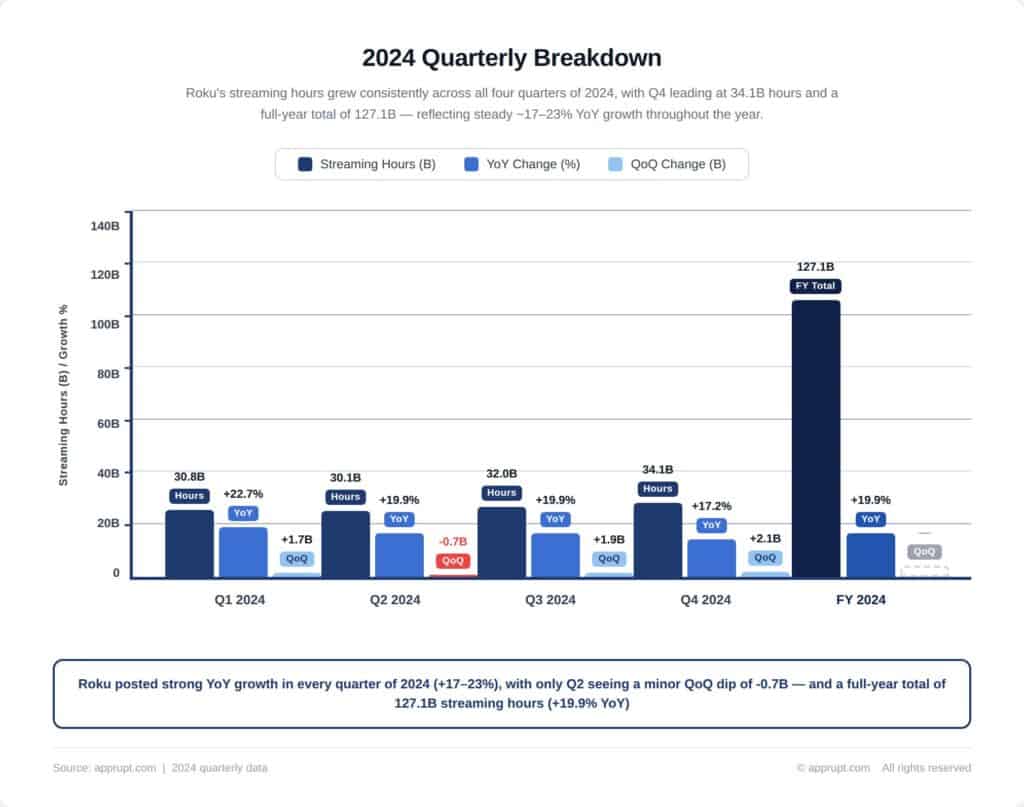
| Quarter | Streaming Hours | YoY Change | QoQ Change |
| Q1 2024 | 30.8B | +22.7% | +1.7B |
| Q2 2024 | 30.1B | +19.9% | -0.7B |
| Q3 2024 | 32.0B | +19.9% | +1.9B |
| Q4 2024 | 34.1B | +17.2% | +2.1B |
| FY 2024 | 127.1B | +19.9% | — |
2025 Quarterly Breakdown
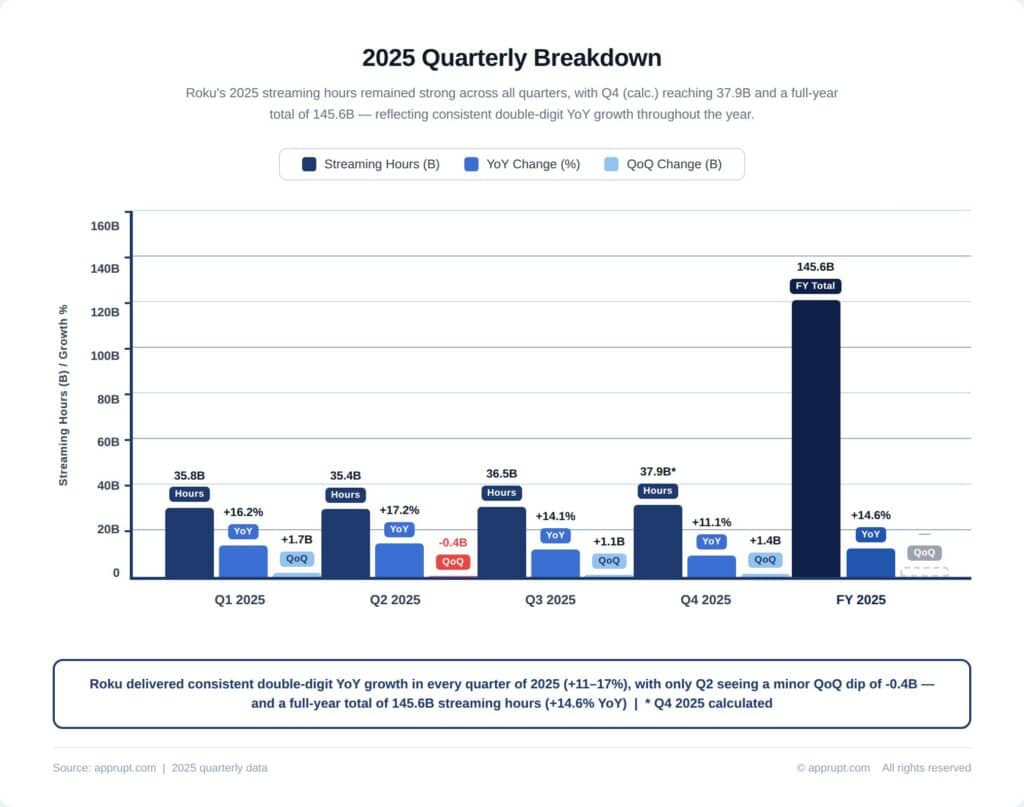
| Quarter | Streaming Hours | YoY Change | QoQ Change |
| Q1 2025 | 35.8B | +5.1B (+16.2%) | +1.7B |
| Q2 2025 | 35.4B | +5.2B (+17.2%) | -0.4B |
| Q3 2025 | 36.5B | +4.5B (+14.1%) | +1.1B |
| Q4 2025 | 37.9B (calc.) | +3.8B (+11.1%) | +1.4B |
| FY 2025 | 145.6B | +18.5B (+14.6%) | — |
Q4 2025 streaming hours can be derived as 145.6B minus Q1–Q3 totals (35.8B + 35.4B + 36.5B = 107.7B), yielding approximately 37.9 billion hours for Q4 2025. This represents the highest single quarter in Roku’s history, driven by the holiday viewing surge—Christmas Day 2025 set a record as the most-streamed day in history across all platforms, with more than 55 billion viewing minutes.
Streaming Hours Per Account
Roku’s engagement depth per household has steadily increased, with the average streaming household watching over 4 hours of content per day.
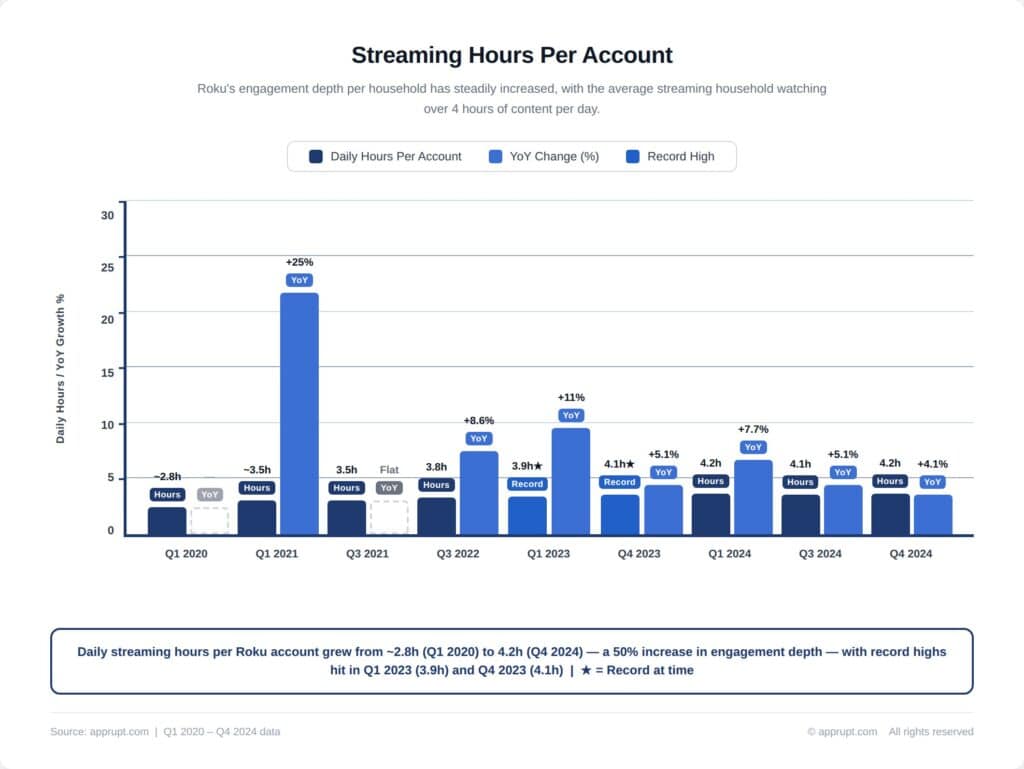
| Period | Daily Streaming Hours Per Account | YoY Change |
| Q1 2020 | ~2.8 hours | — |
| Q1 2021 | ~3.5 hours | +25% |
| Q3 2021 | 3.5 hours | Flat |
| Q3 2022 | 3.8 hours | +8.6% |
| Q1 2023 | 3.9 hours (record at the time) | +11% |
| Q4 2023 | 4.1 hours (record) | +5.1% |
| Q1 2024 | 4.2 hours | +7.7% |
| Q3 2024 | 4.1 hours | +5.1% |
| Q4 2024 | 4.2 hours (253.7 min) | +4.1% |
Roku users streamed an average of 253.7 minutes (approximately 4.2 hours) per day per active account in Q4 2024, up 4.1% year over year. This level of engagement exceeds most individual streaming apps—for context, the average U.S. Netflix household watches approximately 3.2 hours per day. The difference is that Roku captures all streaming activity across all apps on its platform, including Netflix, YouTube, Disney+, and others.
The Roku Channel Streaming Hours
The Roku Channel has been the standout growth story within Roku’s streaming hours, growing dramatically faster than the overall platform.
Roku Channel Growth Milestones
- Q4 2022: The Roku Channel reached U.S. homes with approximately 100 million people.
- Q3 2023: Streaming hours on The Roku Channel grew 50%+ YoY; Nielsen reported it captured 1.1% of total U.S. TV viewing time and 3% of streaming hours.
- Q4 2023: Roku Channel streaming hours grew 63% YoY.
- Q1 2025: More than 85% of streaming hours on The Roku Channel originated from features of the Roku Experience other than the Roku Channel app tile (e.g., home screen recommendations, Live TV Guide).
- Q2 2025: Streaming hours on The Roku Channel increased 84% YoY; it was the second most-engaged service on the platform among U.S. viewers.
- Q3 2025: The Roku Channel accounted for 6.2% of all U.S. TV streaming time, according to Nielsen, and remained the most-viewed FAST service in the country.
- December 2025: The Roku Channel hit a record 6.3% of all U.S. TV streaming and 3% of total U.S. TV viewership (including cable and broadcast), up 45% YoY and 190% vs. two years ago.
- 2020–2025 FAST growth: FAST viewership on the Roku Channel grew 262x faster than the total TV streaming market over this period.
Roku Channel Rankings
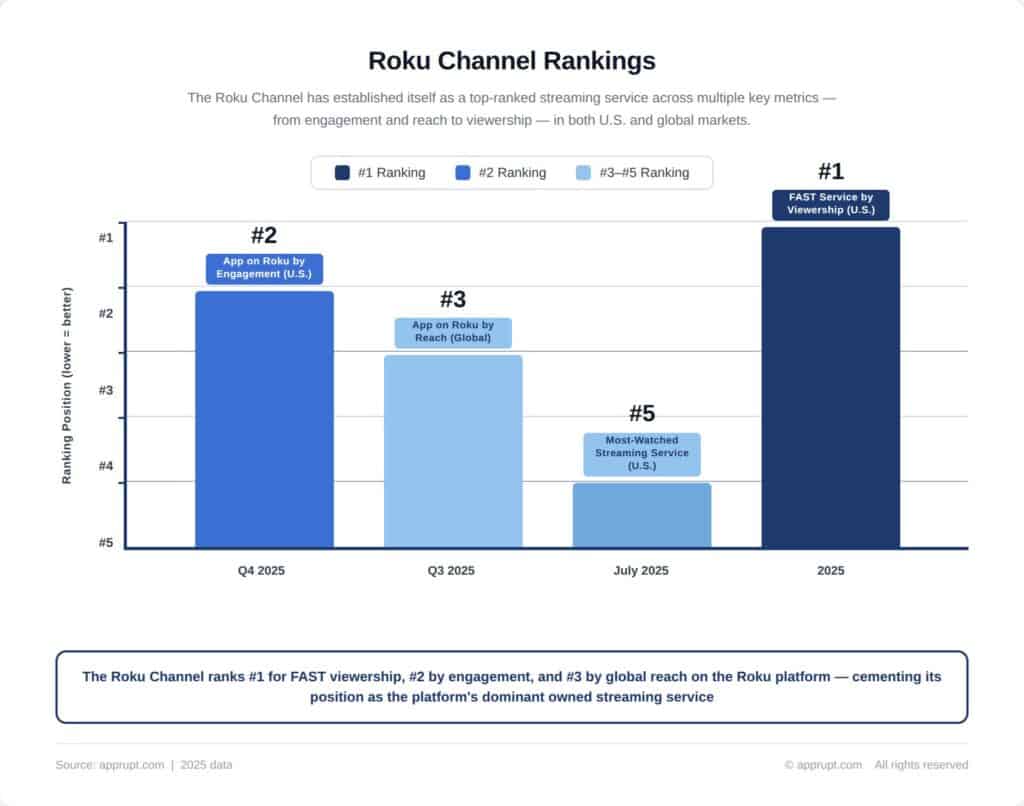
| Ranking | Metric | Period |
| #2 | App on Roku platform by engagement (U.S.) | Q4 2025 |
| #3 | App on Roku platform by reach (global) | Q3 2025 |
| #5 | Most-watched streaming service overall (U.S.) | July 2025 |
| #1 | FAST service by viewership (U.S.) | 2025 |
The Roku Channel trails only YouTube for engagement on the Roku platform and trails YouTube, Netflix, Disney-owned services, and Amazon Prime Video in total streaming viewership nationally.
Streaming Hours in Industry Context
Roku vs. Total U.S. TV Viewing
Streaming on Roku-powered devices accounts for more than 21% of all TV viewing in the United States, according to Nielsen. This exceeds broadcast TV’s share, which fell to approximately 18.4% by mid-2025.
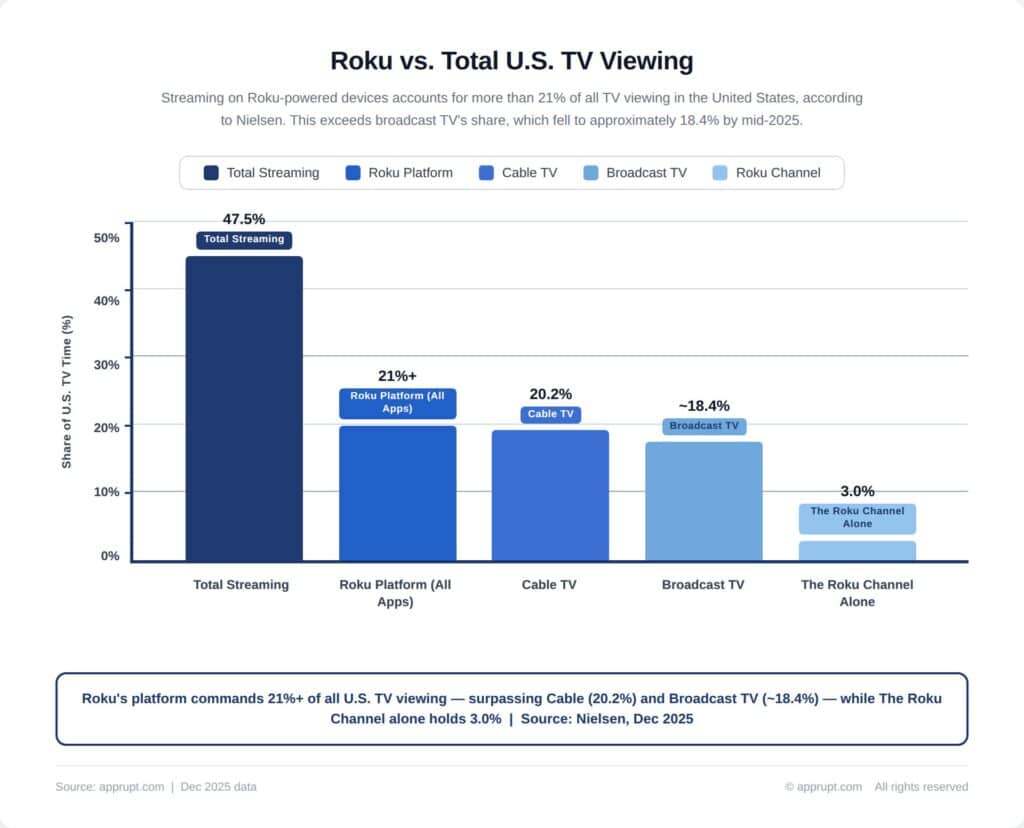
| Viewing Category | Share of U.S. TV Time (Dec 2025) |
| Total streaming | 47.5% |
| Roku platform (all apps) | 21%+ |
| Cable TV | 20.2% |
| Broadcast TV | ~18.4% |
| The Roku Channel alone | 3.0% |
Record-Setting Days
- Christmas Day 2025 was the most-streamed day in history across all platforms, with more than 55 billion viewing minutes.
- December 2025 saw streaming reach an all-time high of 47.5% of all U.S. TV viewing, according to Nielsen.
- The June 2024 U.S. presidential debate delivered The Roku Channel’s FAST offering its “highest day ever for reach and engagement.”
What Drives Streaming Hours Growth
Content Expansion
- Roku now offers more than 500 free live FAST channels on The Roku Channel spanning news, sports, entertainment, and more.
- Law & Order became the first FAST channel dedicated to a series from the Dick Wolf Universe, contributing to extended viewing times.
- Sports programming has been a major engagement driver—visits to NFL Zone more than tripled YoY during kickoff week in 2025.
- Roku launched 17 new free channels in February 2026 alone, including content from Lionsgate and FilmRise.
Platform Experience Innovations
- 87% of Roku Channel FAST viewership originates from the home screen rather than the app tile, demonstrating the power of Roku’s content discovery and recommendation engine.
- AI-powered voice search launched in late 2025 enables natural language content discovery, potentially reducing “time to play.”
- The Sports Experience (live scores, game reminders, and app integrations) drove a nearly 75% YoY increase in subscription sign-ups in Q4 2025.
FAST Viewing Dynamics
- 64% of U.S. Roku households stream FAST channels.
- 9 in 10 FAST streaming hours on Roku occur within The Roku Channel.
- 74% of Roku Channel FAST viewers do not watch FAST content on rival services like Pluto TV or Tubi.
- FAST viewers see an average of 4 minutes of advertising per hour, versus 12 minutes per hour on cable TV.
2026 Outlook
Streaming Hours Trajectory
Roku has designated streaming hours as one of its four key performance metrics (alongside platform revenue, adjusted EBITDA, and free cash flow) and has committed to growing all four over time. While the company does not issue specific streaming hours guidance, several factors point to continued growth in 2026:
- Path to 100 million streaming households: More households means a larger base generating hours.
- FIFA World Cup 2026: The tournament (held in the U.S., Mexico, and Canada) is expected to significantly boost sports streaming hours, particularly through The Roku Channel and partner apps.
- Premium subscription bundles: Planned for launch in 2026, bundles are expected to increase viewer retention and cross-app viewing.
- AI-driven personalization: Roku predicts that AI recommendations will “reduce the time it takes for someone to press play,” increasing total viewing hours per session.
- International expansion: Expansion into new European and Latin American markets adds streaming hours from new household cohorts.
Projected Range
At the 2024→2025 growth rate of 15%, FY 2026 streaming hours would reach approximately 167 billion. However, incremental catalysts (World Cup, 100M households, new markets) could push this closer to 170+ billion. If growth moderates to 12–13% as the base scales, the figure would land around 163–165 billion.
Streaming Hours vs. Revenue Relationship
Streaming hours are the fundamental input to Roku’s monetization flywheel. More hours generate more ad inventory (for FAST and ad-supported tiers), more data for targeting, and more opportunities for subscription discovery.
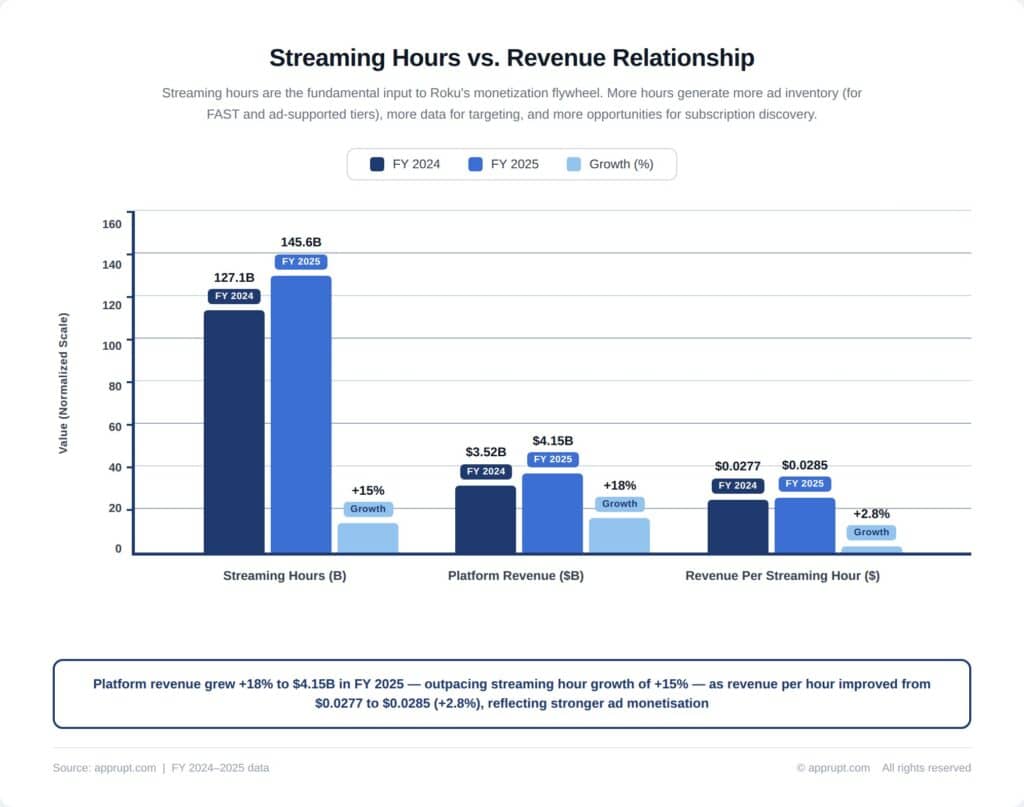
| Metric | FY 2024 | FY 2025 | Growth |
| Streaming hours | 127.1B | 145.6B | +15% |
| Platform revenue | $3.52B | $4.15B | +18% |
| Revenue per streaming hour | $0.0277 | $0.0285 | +2.8% |
Platform revenue is growing faster than streaming hours (18% vs. 15% in 2025), reflecting improving monetization per hour through higher ad load utilization, better programmatic yield, and growing subscription revenue. This “monetization gap”—where revenue grows faster than hours—is a positive indicator of Roku’s ability to extract more value from each unit of engagement.