The U.S. cable TV industry is experiencing a multi-front revenue collapse. Pay TV subscription revenue declined from a peak of $101 billion in 2014 to approximately $83.4 billion in 2025, and is projected to fall to $53–54 billion by 2027 — nearly halving in just 13 years. Linear TV advertising — spanning cable networks, broadcast, and local stations — fell 7% to $55.2 billion in 2025 and is forecast to decline a further 6% in 2026 and 8% in 2027.
Cable network affiliate fees, once the bedrock revenue stream for programmers, are in structural decline as distributors lose subscribers at 5–7% annually. Meanwhile, the broader U.S. broadcasting and cable TV market was valued at $127.5 billion in 2025 and is projected to grow modestly to $155.5 billion by 2035 — but virtually all growth comes from digital/streaming integration, not traditional cable.
The total U.S. subscription TV and video market (cable + streaming combined) is forecast to reach $190.7 billion by 2030, with streaming serving as the sole growth engine.
Pay TV Subscription Revenue
Historical Decline
Pay TV subscription revenue — the fees consumers pay directly for cable, satellite, and IPTV services — peaked at $101 billion in 2014 and has been in steady decline since.
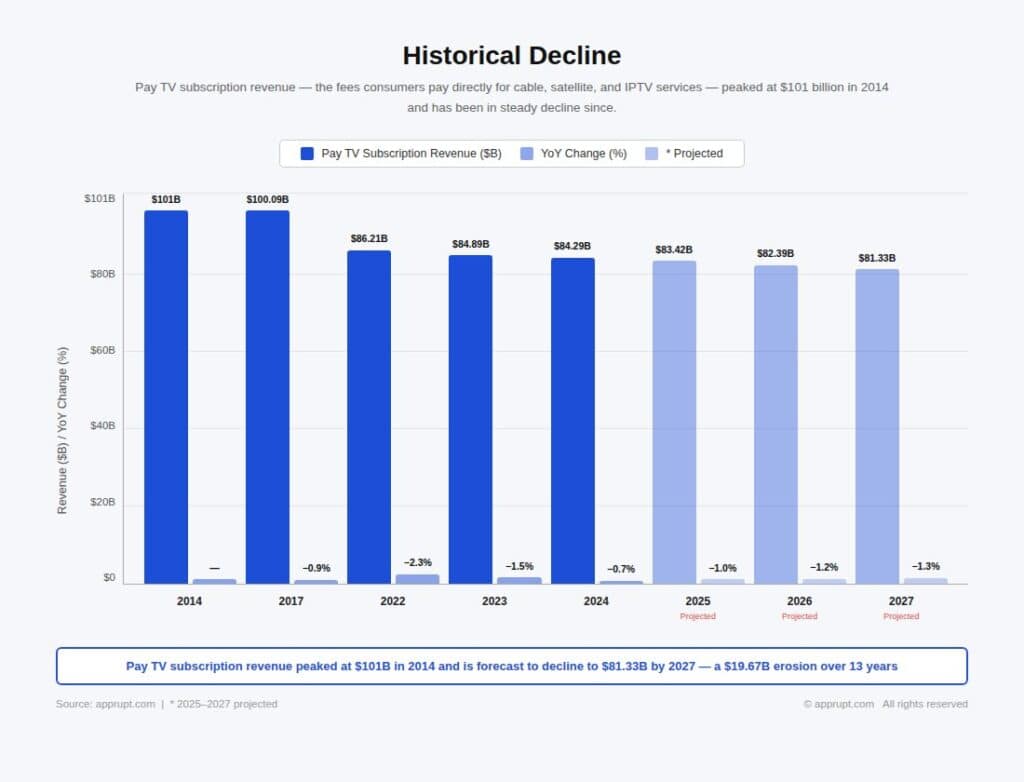
| Year | Pay TV Subscription Revenue | YoY Change |
| 2014 | $101 billion (peak) | — |
| 2017 | $100.09 billion | −0.9% |
| 2022 | $86.21 billion | −2.3% |
| 2023 | $84.89 billion | −1.5% |
| 2024 | $84.29 billion | −0.7% |
| 2025* | $83.42 billion | −1.0% |
| 2026* | $82.39 billion | −1.2% |
| 2027* | $81.33 billion | −1.3% |
Source: Evoca TV/Statista
However, these Evoca figures represent a relatively optimistic scenario. Digital TV Research projects a steeper decline, forecasting pay TV subscription revenue will fall to just $53 billion by 2027 — a $48 billion drop from the 2014 peak. Statista’s December 2023 forecast similarly projects approximately $54 billion in traditional pay TV subscription revenue by 2027, down nearly $20 billion from 2023. The discrepancy stems from definitional differences: broader estimates that include retransmission fees and vMVPD revenue yield higher totals, while pure traditional cable/satellite subscription revenue has fallen more steeply.
Grand View Research estimates the U.S. pay TV market generated $80.5 billion in revenue in 2021 and projects it will shrink to $63.8 billion by 2028, reflecting a negative CAGR of −3.3%. Precedence Research values the U.S. pay TV market at $62.08 billion in 2025, projecting a modest increase to $76 billion by 2034 — though this includes hybrid models integrating streaming.
Revenue Loss by Operator
The operator-level data reveals the concentrated nature of the decline.
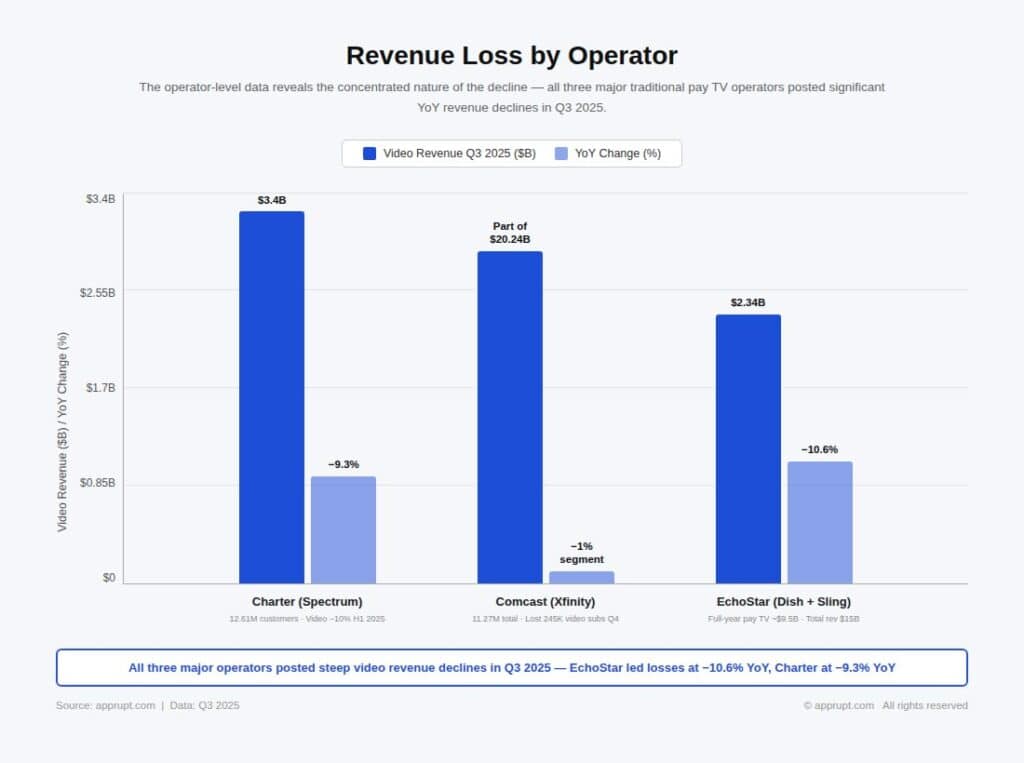
| Operator | Video Revenue (Q3 2025) | YoY Change | Full-Year 2025 Context |
| Charter (Spectrum) | $3.4 billion | −9.3% | Video revenue declined ~10% for H1; ended year with 12.61M customers |
| Comcast (Xfinity) | Part of $20.24B connectivity segment | −1% total segment | Lost 245K video subs in Q4; 11.27M total |
| EchoStar (Dish + Sling) | $2.34 billion | −10.6% | Full-year pay TV revenue ~$9.5B; total company revenue $15B |
Charter’s video revenue fell 9.3% in Q3 2025 to $3.4 billion, driven by subscriber losses, migration to lower-priced packages, and the $106 million cost of streaming apps bundled into Spectrum TV Select (netted against video revenue). For Q4 2025, Charter’s video revenue declined further to $3.24 billion from $3.61 billion a year earlier — despite adding 44,000 video subscribers for the first time in years. The subscriber stabilization came at the cost of ARPU compression, as more customers opted for cheaper plans.
Comcast’s total connectivity and platforms revenue — encompassing broadband, video, voice, and wireless — was $20.24 billion in Q4 2025, down 1% year-over-year. Comcast does not break out video revenue separately, but its loss of 245,000 pay TV subscribers in Q4 (totaling 1.25 million for the full year) and its disclosure of declining programming expenses (due to fewer video customers) point to continued video revenue erosion.
EchoStar’s pay TV division (Dish TV + Sling TV) generated $2.34 billion in Q3 2025 revenue, down 10.6% year-over-year. ARPU increased 1% to approximately $104 per month, but could not offset the 10.8% subscriber decline. The company ended 2025 with 7.00 million pay TV subscribers and reported a full-year net loss of $14.5 billion, primarily from asset impairment charges.
Linear TV Advertising Revenue
The Advertising Collapse
Linear TV advertising — encompassing cable networks, broadcast networks, and local TV stations — is declining faster than subscription revenue, as advertisers accelerate their shift to digital and streaming platforms.
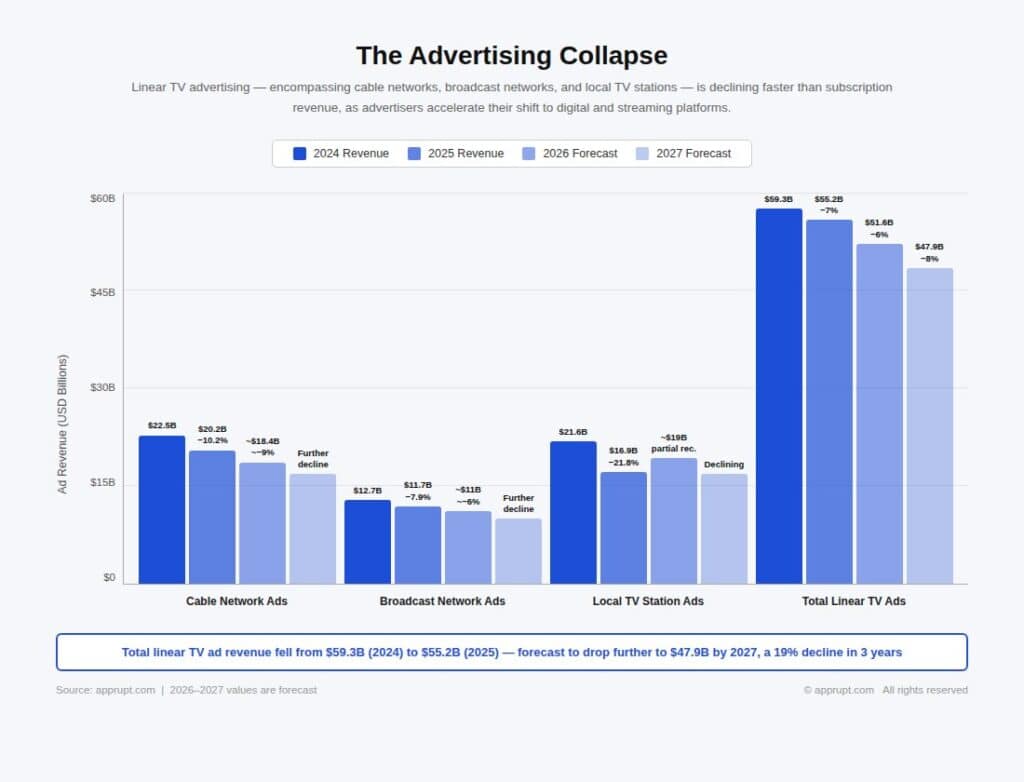
| Segment | 2024 Revenue | 2025 Revenue | 2026 Forecast | 2027 Forecast |
| Cable network ads | $22.5 billion | $20.2 billion (−10.2%) | Declining ~9% | Further decline |
| Broadcast network ads | $12.7 billion | $11.7 billion (−7.9%) | Declining ~6% | Further decline |
| Local TV station ads | $21.6 billion | $16.9 billion (−21.8%) | ~$19B (partial recovery) | Declining |
| Total linear TV ads | $59.3 billion | $55.2 billion (−7%) | $51.6 billion (−6%) | $47.9 billion (−8%) |
Source: MoffettNathanson Research
The 21.8% crash in local TV advertising reflects the absence of 2024’s record political ad spending and Olympics windfall. Cable network advertising declined 9.2% in Q1 2025 alone, with Warner Bros. Discovery down 16%, Paramount down 21%, and NBCUniversal down 8%. Only Fox Corp. posted gains, driven by post-election Fox News viewership growth and Super Bowl advertising on Fox/Tubi.
MoffettNathanson co-founder Michael Nathanson declared: “It is now clear that outside of sports advertising, there should no longer be expectations of a recovery for linear TV advertising”. Total national linear TV advertising revenue was projected to fall 11.4% to $24.3 billion in 2025 (down 7.4% excluding Olympics comparisons).
Streaming Ad Revenue: The Counterweight
While linear declines, ad-supported connected TV (CTV) is growing — but not fast enough to offset losses. CTV ad revenue rose 15% to $16.1 billion in 2025, with forecasts of $19 billion in 2026 and $22 billion in 2027. Total U.S. streaming ad revenue reached $3.6 billion in Q1 2025, up 26% year-over-year.
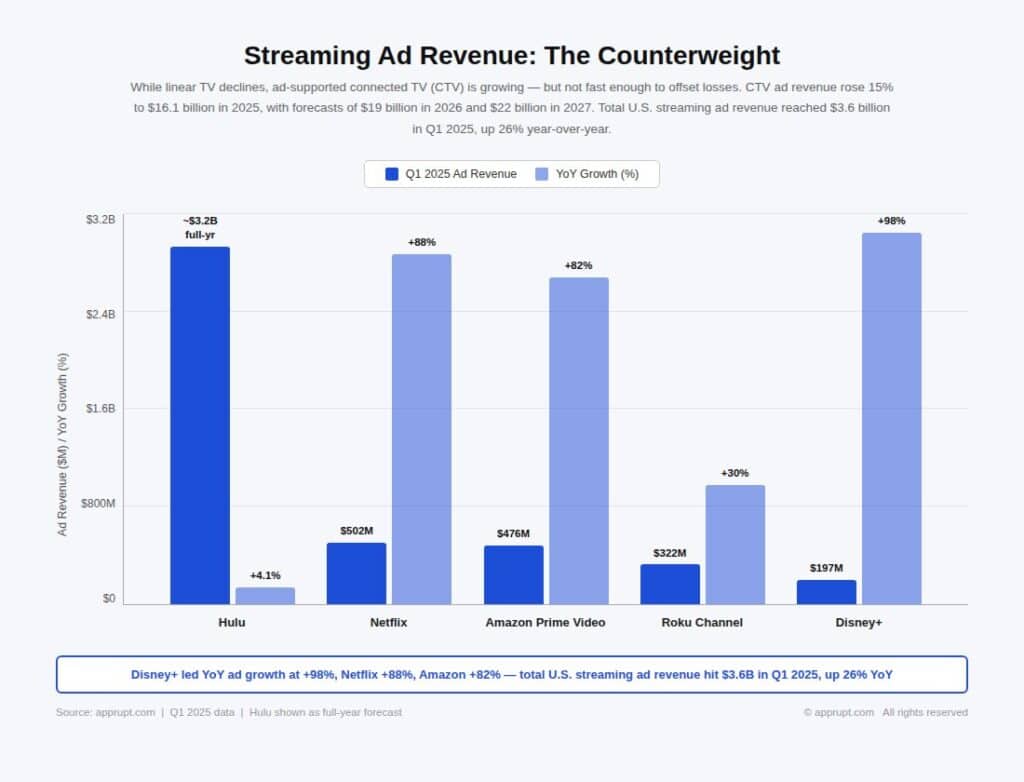
| Streaming Platform | Q1 2025 Ad Revenue | YoY Growth |
| Hulu | ~$3.2 billion (full-year forecast) | +4.1% |
| Netflix | $502 million | +88% |
| Amazon Prime Video | $476 million | +82% |
| Roku Channel | $322 million | +30% |
| Disney+ | $197 million | +98% |
Nathanson cautions that CTV growth is decelerating from double-digit to mid-teens rates as easy linear-to-CTV budget shifts fade: “Without ad products that match the performance, targeting, and measurement advantages of the Big Tech Four [Meta, Alphabet, Microsoft, Amazon], it’s hard to see CTV re-accelerating to prior lofty growth rates”.
Cable Network Revenue: Affiliate Fees Under Pressure
Cable network affiliate fees — the per-subscriber fees that distributors (Comcast, Charter, etc.) pay to networks (ESPN, TNT, Fox News, etc.) — were long the most stable revenue stream in the industry. That era is over.
Structural Decline
Affiliate fee growth has been spiraling downward since Q1 2014, when rates increased by 12%. By Q2 2020, cable network affiliate revenues declined for the first time ever, falling 3% to $9 billion for the quarter. The primary driver is simple math: per-subscriber rate increases can no longer offset 5–7% annual subscriber declines.
S&P Global Market Intelligence projects gross retransmission and virtual subscription revenue will reach $15.4 billion in 2025, rising modestly to $17.5 billion by 2030 as broadcasters charge higher fees. However, after accounting for “reverse compensation” payments to network owners, net retransmission revenue will actually decline slightly to $7.27 billion in 2025 before rebounding to $7.4 billion by 2030.
Versant Media: A Case Study in Cable Network Decline
Comcast’s spinoff of its cable networks into Versant Media Group in January 2026 provides the clearest real-time view of cable network economics. Versant’s first earnings report revealed:
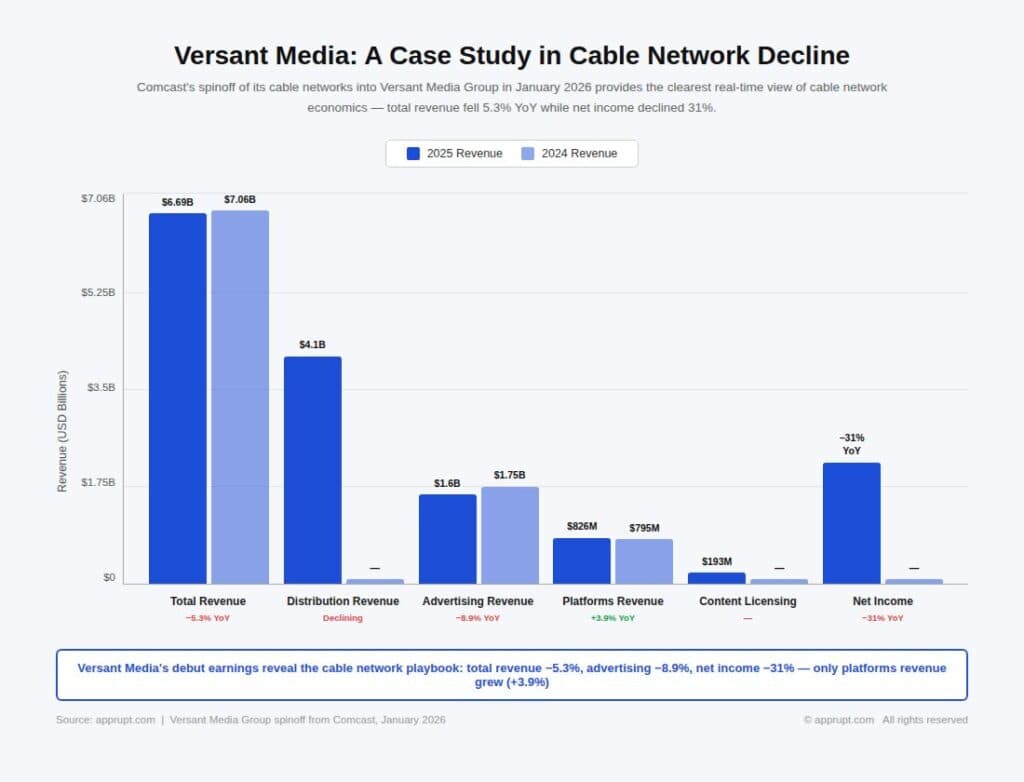
| Metric | 2025 | 2024 | YoY Change |
| Total revenue | $6.69 billion | $7.06 billion | −5.3% |
| Distribution revenue | $4.1 billion | — | Declining |
| Advertising revenue | $1.6 billion | $1.75 billion | −8.9% |
| Platforms revenue | $826 million | $795 million | +3.9% |
| Content licensing | $193 million | — | — |
| Net income decline | — | — | −31% |
CEO Mark Lazarus acknowledged the structural challenge, noting that 81% of Versant’s revenue still comes from traditional pay TV platforms. The company’s stated goal is to shift to 50% non-pay-TV revenue (from 19% currently) over the next three to five years through streaming, subscriptions, and commerce.
U.S. Broadcasting and Cable TV Market
Overall Market Size
Despite the decline in traditional cable subscriptions, the broader U.S. broadcasting and cable TV market — which includes digital broadcasting, IPTV, streaming integrations, and hybrid models — continues to grow modestly.
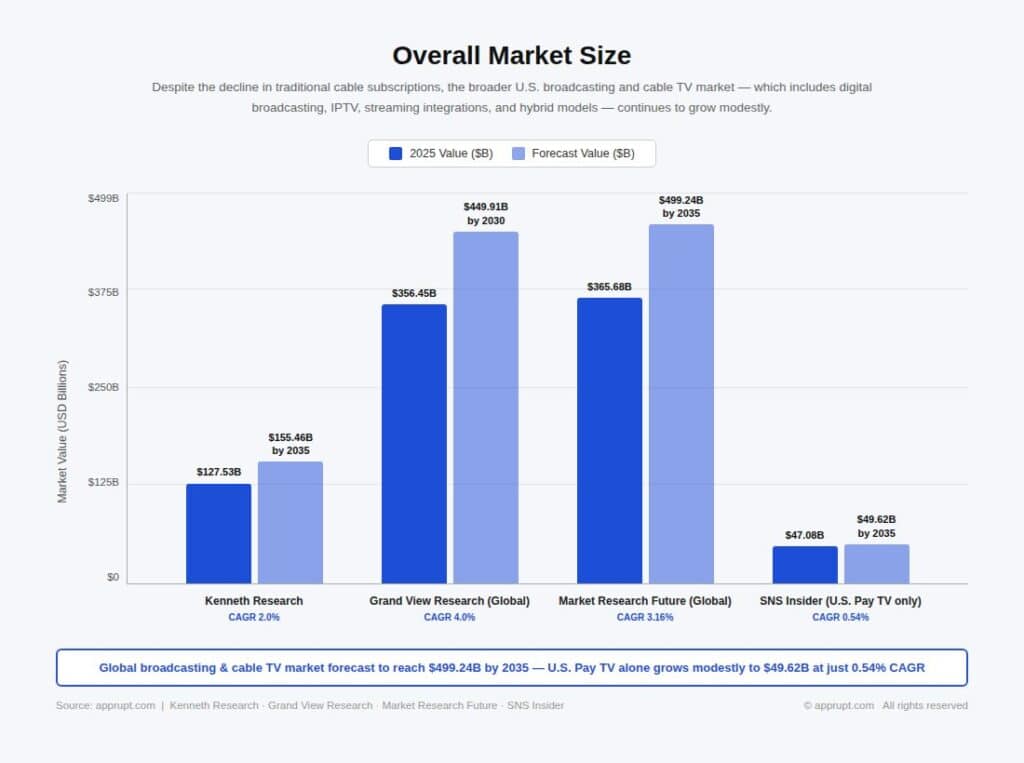
| Research Firm | 2025 Value | Forecast | CAGR |
| Kenneth Research | $127.53 billion | $155.46 billion by 2035 | 2.0% |
| Grand View Research (Global) | $356.45 billion | $449.91 billion by 2030 | 4.0% |
| Market Research Future (Global) | $365.68 billion | $499.24 billion by 2035 | 3.16% |
| SNS Insider (U.S. Pay TV only) | $47.08 billion | $49.62 billion by 2035 | 0.54% |
Kenneth Research values the U.S. broadcasting and cable TV market at $127.53 billion in 2025, with an estimated $129.91 billion in 2026. Growth is driven primarily by the transition to digital ecosystems, hybrid broadcast-streaming models, and data-driven advertising — not by traditional cable subscription gains.
Globally, the broadcasting and cable TV market was valued at $356.45 billion in 2024, projected to reach $449.91 billion by 2030 at a 4.0% CAGR. This global growth is fueled largely by emerging markets in Asia-Pacific and Latin America where IPTV and digital cable penetration is still expanding.
Global Pay TV Revenue Outlook
Revenue Decline Despite Subscriber Gains
A paradox defines the global pay TV market: subscriber counts are growing (driven by low-cost IPTV in developing nations), but revenue is declining (driven by cord-cutting in high-ARPU Western markets).
Digital TV Research forecasts that between 2021 and 2027, 86 countries will add pay TV subscribers while 52 countries will lose them — a net gain of 19 million subscribers globally. However, revenues will decline by $25 billion over the same period because subscriber losses are concentrated in the U.S. and Western Europe, where ARPU exceeds $90/month, while gains come from developing markets with ARPU below $10/month.
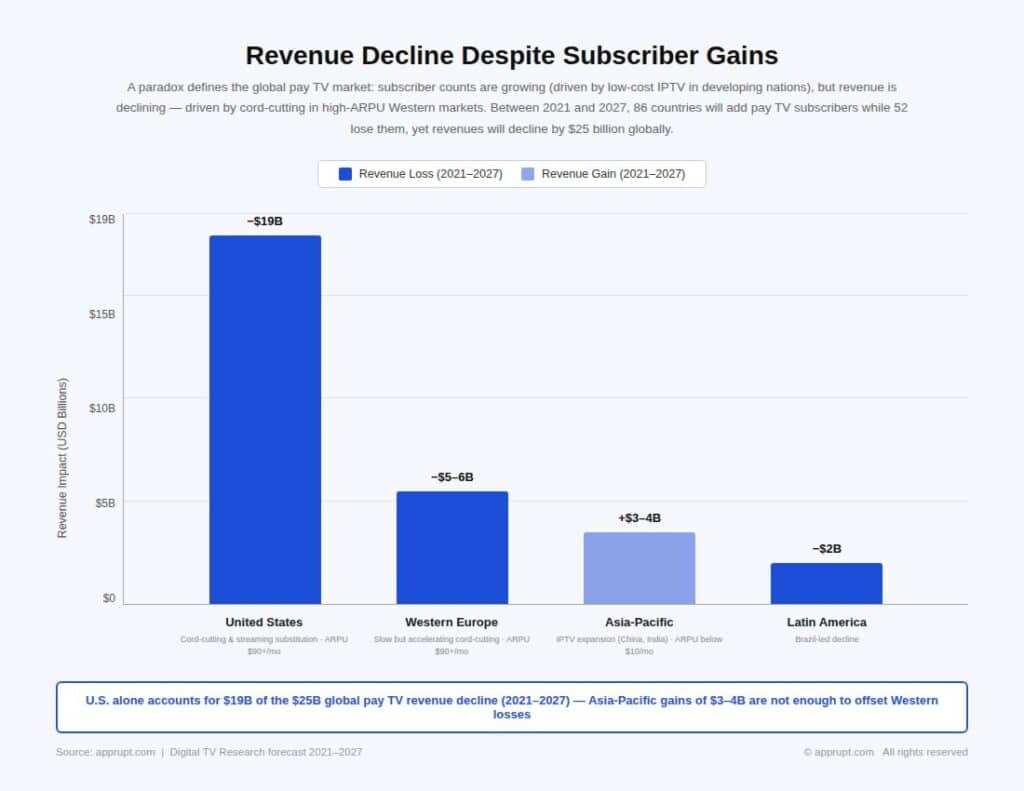
| Region | Revenue Impact (2021–2027) | Key Driver |
| United States | −$19 billion | Cord-cutting, streaming substitution |
| Western Europe | −$5–6 billion | Slow but accelerating cord-cutting |
| Asia-Pacific | +$3–4 billion | IPTV expansion (China, India) |
| Latin America | −$2 billion | Brazil-led decline |
Caretta Research projects the global broadcasting industry and pay TV will lose $42 billion in revenue between 2024 and 2029, while streaming will grow by $93 billion (41%) over the same period.
Total U.S. TV and Video Revenue (Cable + Streaming)
Parks Associates Forecast: $186.5B to $190.7B
When cable TV revenue is combined with streaming subscription and advertising revenue, the total U.S. subscription TV and video market shows modest growth — because streaming gains more than offset cable losses.
Parks Associates projects total U.S. subscription TV and video revenue will rise from $186.5 billion in 2025 to $190.7 billion by 2030. Total subscriptions (cable + streaming) will climb from 719 million in 2025 to 765 million by 2030.
The average monthly household spend on subscription TV and video is projected to grow from $101.25 in 2020 to a peak of $122.74 in 2028, driven by rising streaming prices and service stacking, before a slight dip to $122.04 by 2030.
“As the U.S. video market matures, growth is no longer about adding new households — it’s about optimizing value,” said Michael Goodman, Research Director at Parks Associates. “Our model shows a stable but fundamentally transformed market where streaming is the economic engine and pay TV becomes a smaller, more-specialized segment”.
Revenue Breakdown by Segment
The following table synthesizes the major revenue components of the U.S. cable and TV industry for 2025 with forward projections:
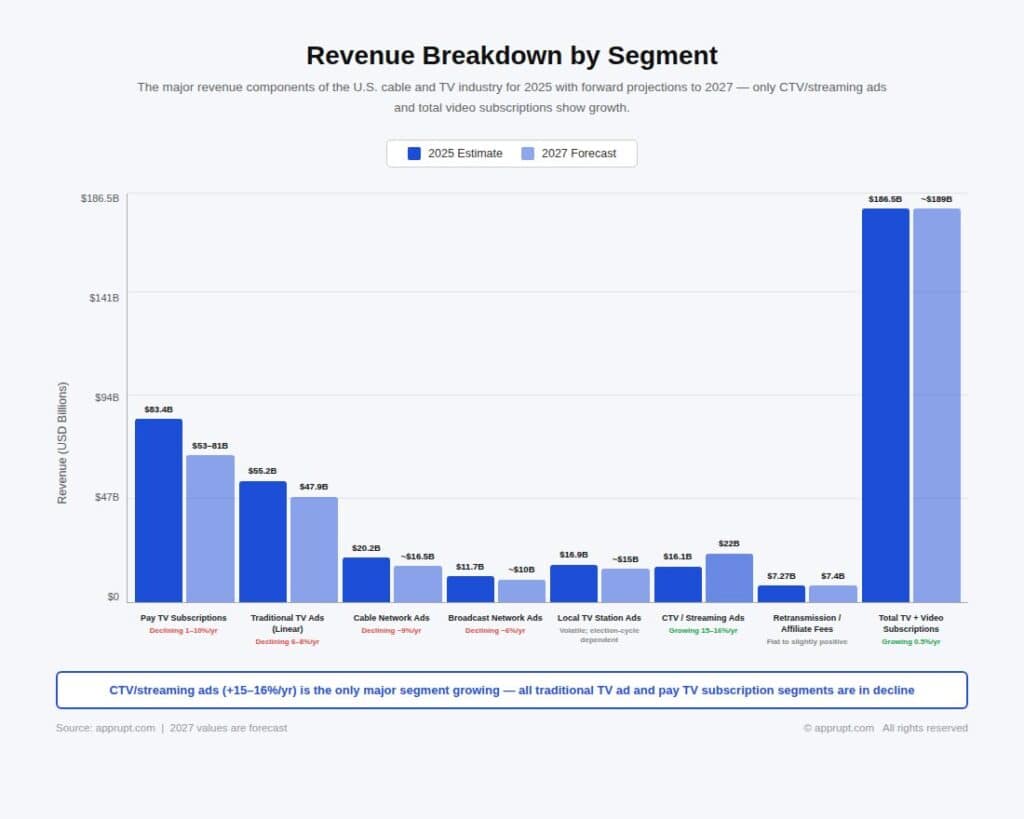
| Revenue Segment | 2025 Estimate | 2027 Forecast | Trend |
| Pay TV subscriptions | $83.4 billion | $53–81 billion | Declining 1–10% annually |
| Traditional TV advertising (total linear) | $55.2 billion | $47.9 billion | Declining 6–8% annually |
| Cable network ads | $20.2 billion | ~$16–17 billion | Declining ~9% annually |
| Broadcast network ads | $11.7 billion | ~$10 billion | Declining ~6% annually |
| Local TV station ads | $16.9 billion | ~$15 billion (est.) | Volatile; election-cycle dependent |
| CTV/streaming ads | $16.1 billion | $22 billion | Growing 15–16% annually |
| Retransmission/affiliate fees (net) | $7.27 billion | $7.4 billion | Flat to slightly positive |
| Total TV + video subscriptions (cable + streaming) | $186.5 billion | ~$189 billion | Growing 0.5% annually |
Operator Revenue Strategies
Charter: Trading Revenue for Retention
Charter’s video revenue declined approximately 9–10% through most of 2025 quarters. The company’s strategy of bundling streaming apps (Disney+, Hulu, HBO Max, Peacock, Paramount+, AMC+) into Spectrum TV Select at no extra cost has stabilized subscriber counts — Charter added 44,000 video subscribers in Q4 2025 — but compressed video ARPU. Charter allocated $106 million per quarter toward programmer streaming app costs, netted against video revenue. Monthly residential revenue per customer was $122.63 in Q3 2025, up just 1% year-over-year, with video mix deterioration offsetting rate increases.
Comcast: Pivoting to Peacock and Wireless
Comcast’s full-year 2025 revenue was $123.7 billion, essentially flat year-over-year. The bright spots were Peacock ($5.4 billion revenue, +10% YoY, 44 million paid subscribers) and wireless (domestic wireless revenue up ~20%). Media revenue grew 6% in Q4, aided by the new NBA rights deal. However, the connectivity and platforms segment — which includes video — declined 1%, reflecting broadband and video subscriber losses. Comcast’s strategic response was to spin off its declining cable networks into Versant Media, allowing NBCUniversal to focus on Peacock, studios, and theme parks.
EchoStar: Survival Mode
EchoStar reported total 2025 revenue of $15.00 billion (down from $15.83 billion in 2024), with pay TV revenue declining roughly 10% year-over-year. The company’s net loss of $14.5 billion in 2025 — driven by massive asset write-downs — underscores the existential nature of the challenge for satellite TV operators. EchoStar’s strategic future hinges on its 5G wireless buildout, not pay TV.
Conclusion
The cable TV industry’s revenue structure is being dismantled from multiple directions simultaneously. Subscription revenue is declining at 1–3% annually even by optimistic estimates, with steeper projections showing a near-50% drop from the 2014 peak by 2027. Advertising revenue is falling 7–8% annually as budgets shift to digital and streaming. Affiliate fees are under structural pressure as the subscriber base erodes. The only growing segments — CTV advertising (+15–16% annually) and streaming subscriptions — belong to platforms that are displacing cable, not sustaining it. Total industry revenue (cable + streaming combined) will grow modestly to $190.7 billion by 2030, but this masks a dramatic reallocation: streaming will account for an ever-larger share while traditional cable contracts to a specialized, sports-and-news-dependent niche generating progressively less revenue each year.