The streaming subscription landscape has transitioned from an era of explosive growth to one defined by retention economics. Monthly churn for video streaming services climbed from approximately 2% in 2019 to 5.5% by early 2025, and annualized churn rates exceed 30% across streaming video broadly. However, 2025 marked a turning point — the weighted average churn rate for premium SVOD stabilized at 4.6%, a significant improvement over prior volatility. As the industry matures toward 2033, churn management, bundling strategies, ad-supported tiers, and AI-driven retention are reshaping the competitive landscape. The global video streaming market, valued at approximately $130 billion in 2024, is projected to reach between $242 billion and $692 billion by 2033 depending on the scope of measurement.
Current State of Streaming Churn (2025 Baseline)
Industry-Wide Churn Benchmarks
Video streaming suffers significantly higher churn than audio streaming. The annual churn rate for video streaming stands at roughly 40%, compared to just 12% for audio services. Most video platforms contend with 5–10% monthly churn rates, while music leader Spotify maintains a monthly churn below 1.5%. OTT churn rates can range from 5% to as high as 30% per month depending on the service and region.
By Q3 2023, OTT service churn hit an all-time high of 50%, meaning one in two users left their subscriptions that quarter. Since then, churn has moderated. Antenna’s Q1 2026 State of Subscriptions report confirmed that premium SVOD churn stabilized at a weighted average of 4.6% throughout 2025 — down from 4.8% in December 2024. Between September 2024 and August 2025, the premium SVOD category had flat or lower churn in 7 of 11 months compared to the same month in the prior year, a dramatic reversal from only 2 of the previous 21 months showing improvement.
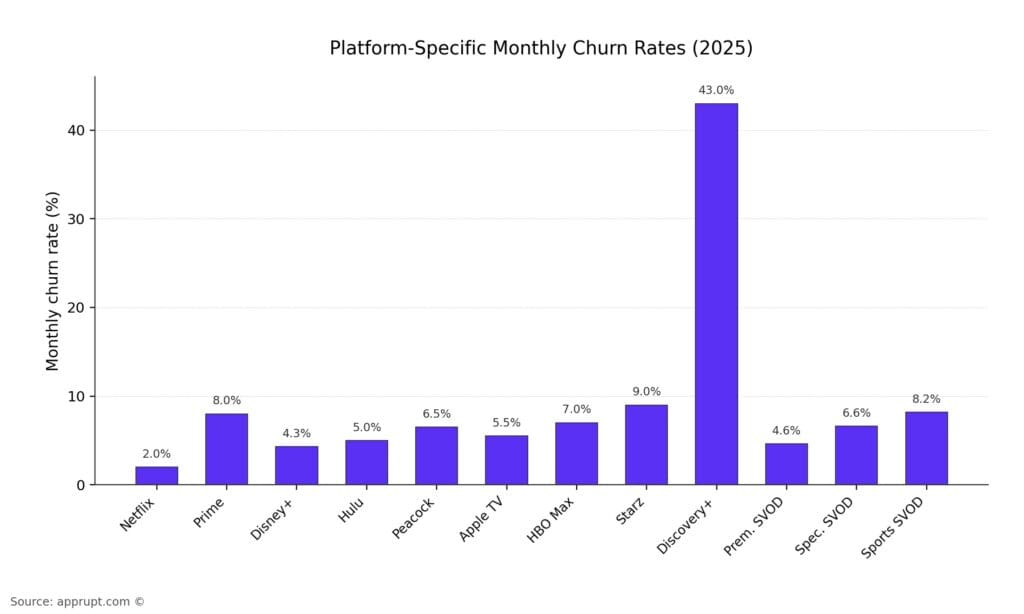
Platform-Specific Monthly Churn Rates (2025)
| Platform | Monthly Churn Rate | Notes |
| Netflix | ~2% | Lowest among video platforms; steady regardless of price hikes |
| Prime Video | ~8% (quarterly) | Lowest among largest providers per Parks Associates; benefits from Prime bundling |
| Disney+ | ~4.3% | Spiked to 7.8% in Sept 2025 (Jimmy Kimmel controversy); normalized to 4.1% by Dec 2025 |
| Hulu | ~5% | Spiked to 9.6% in Sept 2025; normalized to 4.9% by Dec 2025 |
| Peacock | 5–8% | Plateaued at 41M subscribers; churn offsets new acquisitions |
| Apple TV | 5–6% | Moderate churn with limited content library |
| HBO Max | ~7% | Relatively stable; held at 7% between May–June 2025 |
| Starz | ~9% | Among the highest churn rates of major services |
| Discovery+ | ~43% | Highest churn among tracked major providers |
| Premium SVOD (weighted avg.) | 4.6% | Stabilized in 2025, a significant improvement over prior years |
| Specialty SVOD | 6.6% | Down from 7% the prior year; includes AMC+, BritBox, Crunchyroll |
| Sports SVOD | 4.4–12% | Highly seasonal; peaks after NFL season ends |
Voluntary vs. Involuntary Churn
Approximately 66% of streaming churn is voluntary — subscribers actively choosing to cancel — while 34% is involuntary, caused by payment failures such as expired credit cards. Involuntary churn accounts for 20–40% of total customer churn across the broader subscription economy. For streaming and entertainment specifically, the median involuntary churn rate stands at 2.1% monthly, with an at-risk threshold at 4.8%.
Key Churn Drivers in the Streaming Market
Cost Sensitivity
Cost has overtaken content as the primary driver of churn. In 2025, 30% of consumers cited cutting household expenses as their top reason for canceling a streaming service, up from 26% in 2020. An additional 20% said a price increase specifically motivated their cancellation. Among those who dropped a service, 66% said it was simply too expensive.
Content Completion and Rotational Viewing
Nearly one in four subscribers cancel after finishing the show they signed up to watch. About one in five leave because they cannot find anything new to watch. This has given rise to “serial churners” — an estimated 23% of the streaming audience who rotate between services to follow content. Among younger viewers aged 18–34, more than half (58%) report engaging in strategic subscription cycling, signing up for a service, binge-watching, and canceling.
Subscription Fatigue
Surveys show that 72% of subscription consumers believe there are too many subscription services available. Among Gen Z specifically, 37% canceled at least one streaming service since December 2025 due to feeling overwhelmed, and 8 in 10 admitted to signing up for a specific show and then canceling afterward. Adults aged 18–34 are 19% more likely to be at high risk for churn from their SVOD services than older demographics.
Advertising Frustration
While ad-supported tiers help retain price-sensitive subscribers, ad experience quality is deteriorating. Cancellations due to excessive ads rose by 8% in Q2 2025, now accounting for 4% of all paid streaming churn in the U.S.. Over 70% of viewers say the same ads repeat too often, making ad repetition the leading frustration among ad-supported streaming users.
Password Sharing Crackdowns
Sharing subscriptions with friends or family emerged as the fastest-growing churn driver in 2025, increasing by 10% quarter over quarter as consumers sought to manage rising costs.
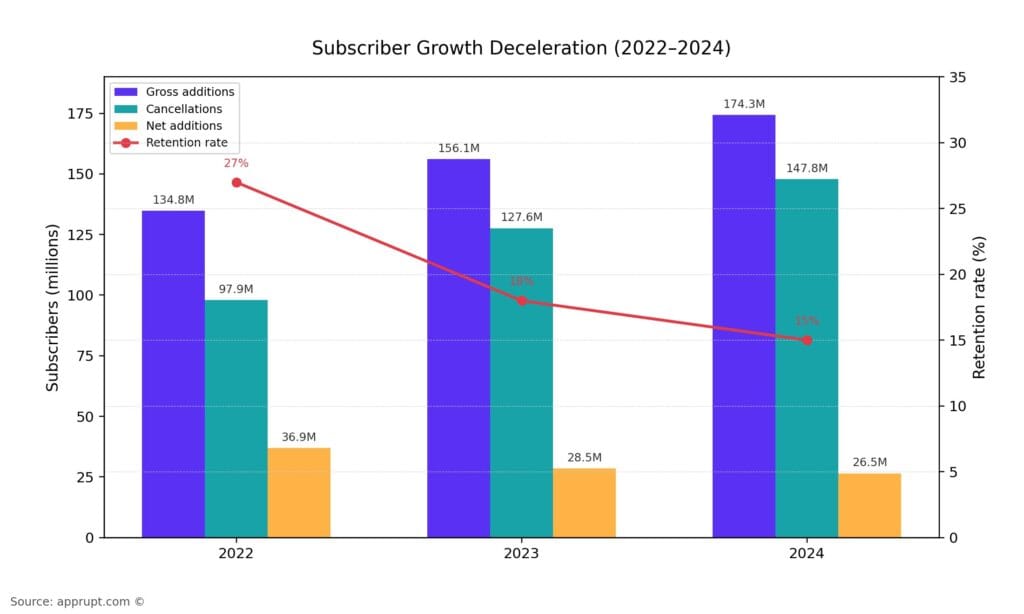
Subscriber Growth Deceleration (2022–2025)
The era of double-digit streaming growth is over. Antenna’s data illustrates a clear trend of slowing net subscriber additions and declining retention rates:
| Year | Gross Additions | Cancellations | Net Additions | Retention Rate |
| 2022 | 134.8M | 97.9M | 36.9M | 27% |
| 2023 | 156.1M | 127.6M | 28.5M | 18% |
| 2024 | 174.3M | 147.8M | 26.5M | 15% |
Premium SVOD subscriber growth slowed to just 7% in 2025, down from 12% in 2024. Gross additions also grew only 7% in 2025, a 4-percentage-point year-over-year decline. Total U.S. streaming subscriptions reached 339 million in Q2 2025, growing 10% year-over-year, down from approximately 12% at the same point in 2024.
Despite this deceleration, streaming penetration remains near-universal. Over 91% of U.S. internet households subscribe to at least one SVOD service, and the average SVOD household maintains 5.8 subscriptions — up from 5.5 in 2021.
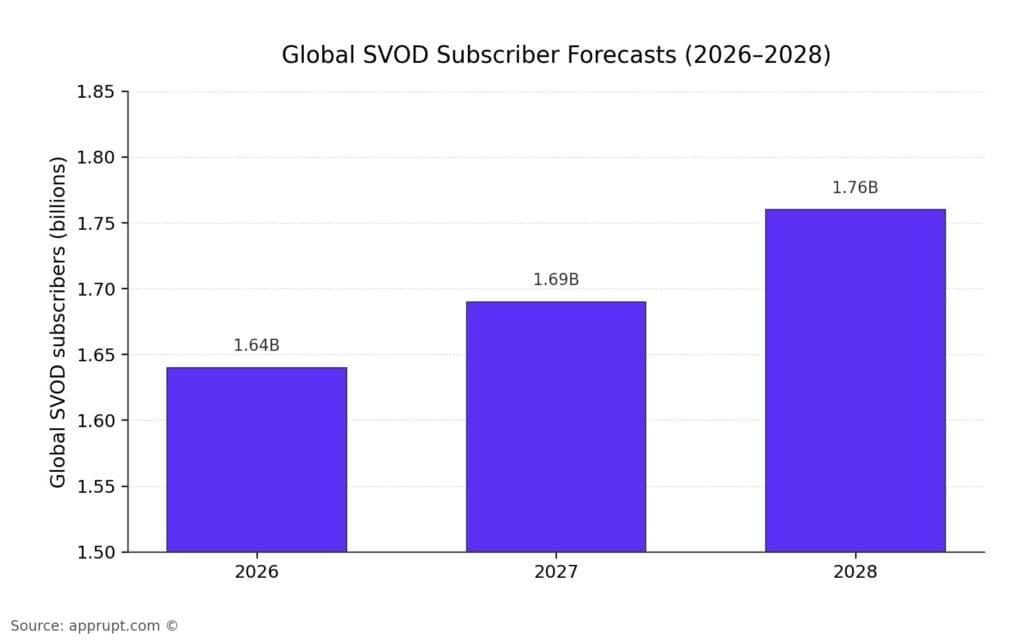
Global SVOD Subscriber Forecasts (2026–2033)
| Year | Global SVOD Subscribers (Projected) | Source |
| 2026 | ~1.64 billion | Digital TV Research |
| 2027 | ~1.69 billion | Digital TV Research |
| 2028 | ~1.76 billion | Digital TV Research |
Six U.S.-based platforms (Netflix, Disney+, Amazon, Paramount+, HBO, Apple TV+) are projected to collectively reach approximately 972–988 million SVOD subscribers by 2027–2028. Chinese SVOD services are expected to contribute approximately 424 million additional subscribers.
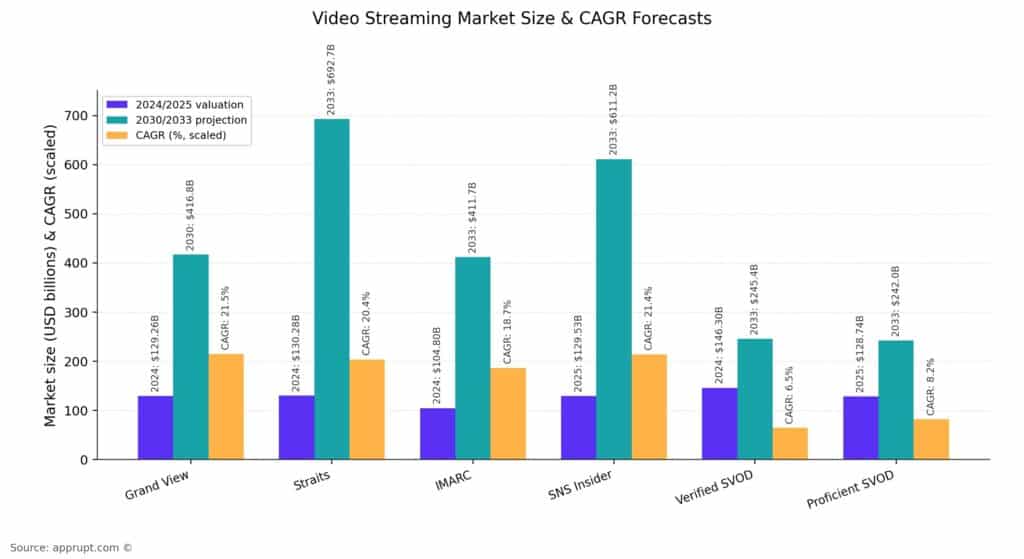
Video Streaming Market Size Forecasts (2026–2033)
Market size projections vary based on scope (SVOD-only vs. all video streaming including AVOD, live, and transactional), but all point to significant expansion:
| Source | 2024/2025 Valuation | 2033 Projection | CAGR |
| Grand View Research | $129.26B (2024) | $416.8B (2030) | 21.5% |
| Straits Research | $130.28B (2024) | $692.68B (2033) | 20.40% |
| IMARC Group | $104.8B (2024) | $411.7B (2033) | 18.66% |
| SNS Insider | $129.53B (2025) | $611.19B (2033) | 21.42% |
| Verified Market Reports (SVoD only) | $146.3B (2024) | $245.4B (2033) | 6.5% |
| Proficient Market Insights (SVoD only) | $128.74B (2025) | $242.02B (2033) | 8.21% |
AVOD and hybrid AVOD-SVOD models are expected to command a growing share, with advertising-led models on a 14.7% CAGR path and anticipated to represent 27.85% of global streaming revenue by 2028. Streaming advertising revenue could grow by 68% between 2023 and 2028, compared to 28% growth for subscription revenue alone.
Churn Outlook and Projections (2026–2033)
2026: The Retention-First Era
Industry analysts position 2026 as the year retention becomes the defining challenge for streaming services. Key themes include:
- Expansion of bundles: 2026 will bring larger, more diverse bundles from pay-TV operators, telcos, and aggregators, increasingly combining TV with gaming, music, grocery delivery, fitness, and e-learning.
- Pricing as retention strategy: Platforms treating affordability as a retention tool rather than a discount tactic are better positioned. Average SVOD revenue per service is projected to reach $11.30 by end of 2026.
- Persistent fragmentation-driven churn: Sports fans forced to use multiple services face heightened churn pressure; services failing to offer flexible, user-centric subscription models will face persistent churn challenges.
Medium-Term Churn Trajectory (2027–2030)
Several structural forces are expected to influence churn rates through the late 2020s:
- Bundling as the primary churn defense: Bundled Disney+/ESPN+/Hulu offerings have already demonstrated the power of multi-service packages, reducing Disney+ 6-month churn from 43% standalone to just 19% when bundled. Bundled subscribers retained at an 80% rate after 3 months, stickier than Netflix standalone at the time (74%). Bob Iger acknowledged on Disney’s Q4 2025 earnings call that bundled subscribers have significantly lower churn rates than single-app subscribers.
- Ad-tier maturation: Ad-supported tiers have become the strongest retention lever, outpacing features like pause options or loyalty pricing. By 2028, hybrid AVOD-SVOD subscribers are expected to comprise the majority of major platforms’ subscriber bases — Disney+ at 88% and Netflix at 24% of total.
- Churn becomes cyclical, not permanent: Research highlights that churn is increasingly cyclical rather than a permanent loss. A quarter (25%) of subscribers who cancel resubscribe within just three months. Subscription growth is concentrating around key programming events, with Q4 driving 31% of annual gross adds and 57% of net adds in 2025.
Long-Term Structural Trends (2030–2033)
- AI-driven retention: Companies using advanced analytics to anticipate customer needs have reduced churn by up to 15%. Peacock’s personalized “Year-in-Review” campaign cut 30-day churn by 20%. As AI recommendation engines mature, platforms deploying smarter personalization and predictive churn models will gain significant retention advantages.
- Market consolidation: Further M&A activity could reduce the number of standalone services, naturally lowering churn driven by subscription overload. The trend is already visible in Hulu’s full integration into Disney+ and ongoing co-opetition bundles between previously rival platforms.
- Emerging market growth: Asia-Pacific contributed nearly 47% of global SVOD user growth in 2024. As emerging markets mature, they may follow similar churn patterns to what North America and Europe experienced between 2020–2025.
- Annual plan adoption: Annual billing reduces churn by approximately 40% compared to monthly billing. Wider adoption of annual plans, especially incentivized through discounts, could structurally lower industry-wide churn rates.
Retention Strategies Shaping the 2026–2033 Period
Bundling
Bundling remains the single most powerful retention mechanism. Multi-service bundles not only reduce individual service churn but create ecosystem lock-in that raises the perceived cost of cancellation. ESPN+ churn dropped from approximately 8% to 3% when sold as part of the Disney bundle. As bundles expand beyond entertainment to include non-video services (fitness, groceries, e-learning), their stickiness is expected to increase further.
Ad-Supported Tiers
Lower-cost ad-supported plans serve dual purposes: retaining cost-sensitive subscribers who might otherwise churn, and lowering the entry barrier for new sign-ups. Netflix’s ad tier brought in 50% of new subscribers in Q3 2024, and ad-supported tiers accounted for 28% of new subscriber additions across major platforms in 2024. The delicate balance lies in ad quality — as 70% of viewers cite repetitive ads as their top frustration, platforms must invest in ad-tech to avoid undermining the retention benefit.
Personalization and AI
AI-powered recommendation engines are deployed by approximately 75% of leading platforms. Beyond content recommendations, AI is being applied to predict churn risk, automate retention offers, and personalize subscription plans. The combination of prediction, personalization, pricing, and customer experience optimization represents the emerging retention stack.
Flexible Subscription Models
The rise of rotational viewing behavior demands new subscription models. Pause-and-resume options, time-limited access passes, and event-based subscriptions are emerging as tools to convert serial churners into recurring — if intermittent — subscribers. Services that accommodate rather than fight this behavior stand to benefit from the 25% resubscription rate within three months.
Key Statistics Summary
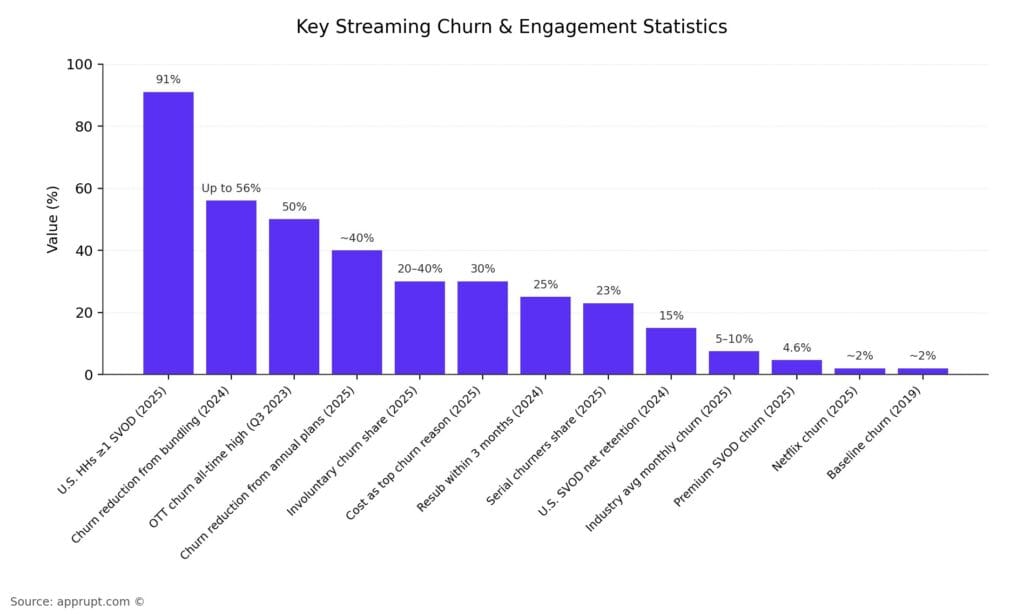
| Metric | Value | Year |
| Video streaming monthly churn (industry avg.) | 5–10% | 2025 |
| Premium SVOD weighted avg. churn | 4.6% | 2025 |
| Netflix monthly churn | ~2% | 2025 |
| Churn in 2019 (baseline) | ~2% monthly | 2019 |
| OTT churn all-time high | 50% | Q3 2023 |
| U.S. SVOD net retention rate | 15% | 2024 |
| Cost as top churn reason | 30% | 2025 |
| Serial churners (audience share) | 23% | 2025 |
| Resubscription within 3 months | 25% | 2024 |
| Involuntary churn share | 20–40% of total | 2025 |
| U.S. households with ≥1 SVOD | 91% | 2025 |
| Avg. subscriptions per household | 5.8 | 2025 |
| Churn reduction from bundling | Up to 56% (Disney+ example) | 2024 |
| Churn reduction from annual plans | ~40% | 2025 |
| Global SVOD subs forecast (2028) | 1.76 billion | Projected |
| Video streaming market (2033 est.) | $242B–$693B | Projected |