The global subscription economy, valued at approximately $565–$624 billion in 2025, is experiencing a paradox: the market continues to grow at a rapid pace (13–18% CAGR), yet cancellation rates are climbing across nearly every category. Over 52% of consumers canceled at least one subscription in the past year, average U.S. households have trimmed their subscriptions from 4.1 to 2.8, and streaming monthly churn has nearly tripled from 2% in 2019 to 5.5% in 2025. This report compiles the most current subscription cancellation statistics across industries, cancellation reasons, involuntary churn, retention benchmarks, regulatory developments, and consumer behavior trends.
Subscription Market Overview
The global subscription economy is projected to reach $565.6 billion in 2025, growing at a CAGR of 15.7% to approximately $2.1 trillion by 2034. Another estimate places the 2025 market at $623.61 billion, forecasting growth to $1.44 trillion by 2030 at an 18.2% CAGR. North America accounts for roughly 42% of the global market, with Media & Entertainment representing the dominant industry vertical at 26% market share.
Despite widespread cancellation activity, 78% of adults worldwide now hold at least one paid subscription. The average consumer maintains 5.6 active subscriptions, while U.S. internet households subscribe to an average of 12 digital services. Parks Associates reports that 91% of U.S. internet households pay for at least one streaming subscription, with the average household holding six streaming services and spending about $109 per month. U.S. adults spend an average of $1,080 annually on subscriptions.
Consumer Cancellation Behavior
Cancellation Rates
- 52% of consumers canceled at least one subscription in the past year, according to the 2026 State of Subscriptions report.
- 81.1% of respondents have canceled or attempted to cancel a subscription within the last six months.
- Consumer subscription cancellation rates hit a record high of 29% earlier in 2025 before dropping to 24.9% by August 2025.
- 40.3% of consumers reported canceling a subscription service in 2024, with video streaming being the most commonly canceled (54.5%), followed by music streaming (22.9%).
Spending Cuts
The average U.S. household cut its subscriptions from 4.1 in 2024 to just 2.8 in 2025, a steep 32% drop in a single year. Household spending on subscriptions decreased from $40.39 to $37 per month, an 8.4% decline. Nearly half of subscribers (49.7%) say that any further price increase would be unacceptable.
Hidden Subscription Costs
Consumers dramatically underestimate their recurring spend. C+R Research found that respondents estimated they spent $86 per month on subscriptions, but actual itemized spending averaged $219 per month — a $133 monthly gap. Meanwhile, 74% say recurring charges are easy to forget, and 42% admitted paying for subscriptions they no longer used. Unused subscriptions cost Americans an estimated $127 per year on average.
Top Reasons for Subscription Cancellation
Cost and perceived value dominate cancellation reasons across all categories. The table below consolidates the most reported reasons from multiple surveys:
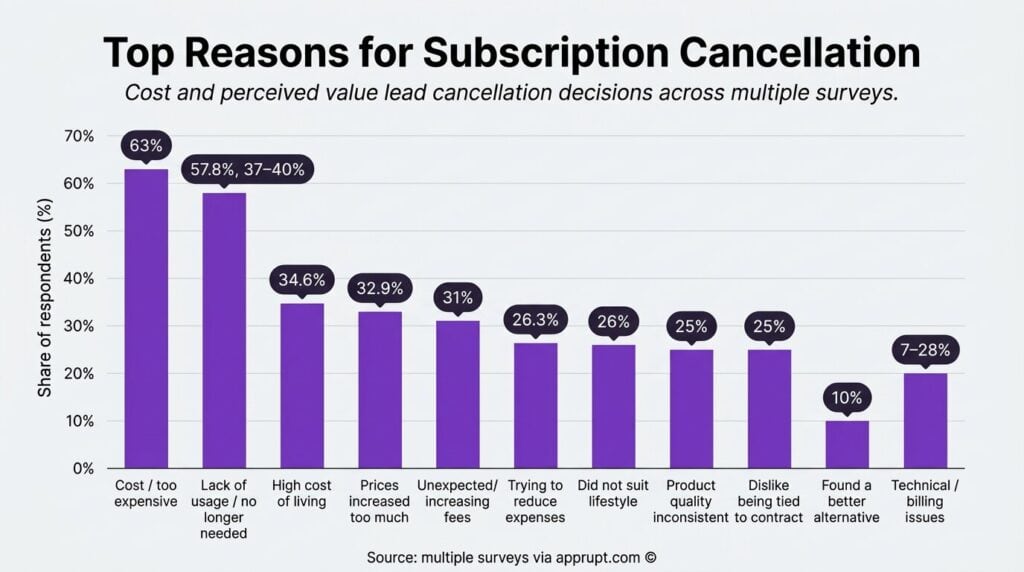
| Cancellation Reason | Percentage | Source Context |
| Cost / too expensive | 63% | Cross-industry survey |
| Lack of usage / no longer needed | 57.8%, 37%–40% | Cross-industry, apps |
| High cost of living | 34.6% | Self Financial 2025 |
| Prices increased too much | 32.9% | Self Financial 2025 |
| Unexpected/increasing fees | 31% | PwC via Statista 2023 |
| Trying to reduce expenses | 26.3% | Self Financial 2025 |
| Did not suit lifestyle | 26% | PwC via Statista 2023 |
| Product quality inconsistent | 25% | PwC via Statista 2023 |
| Dislike being tied to contract | 25% | PwC via Statista 2023 |
| Found a better alternative | 10% | App subscriptions |
| Technical / billing issues | 7%–28% | App subscriptions |
In streaming specifically, 45% of users cite high costs as the primary reason for cancellation, followed by completion of specific shows, limited content variety, and budget constraints. Deloitte’s 2025 survey found 60% would cancel their favorite SVOD service after just a $5 price increase, and 47% believe they pay too much for streaming services.
Importantly, stated cancellation reasons often differ from actual drivers. Research indicates that the stated reason matches the actual churn driver less than 27% of the time, with price being the most commonly misattributed reason.
Churn Rates by Industry
SaaS (Software as a Service)
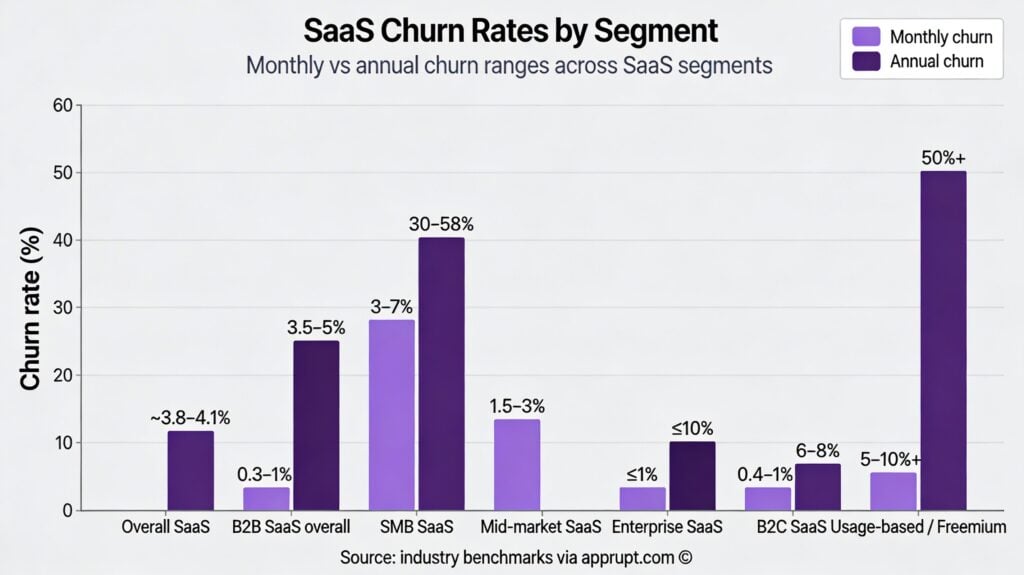
| Segment | Monthly Churn | Annual Churn | Notes |
| Overall SaaS | — | ~3.8%–4.1% | 3.0% voluntary, 1.1% involuntary |
| B2B SaaS overall | 0.3%–1% | 3.5%–5% | Bigger firms have lower churn |
| SMB SaaS | 3%–7% | 30%–58% | High price sensitivity |
| Mid-market SaaS | 1.5%–3% | — | — |
| Enterprise SaaS | ≤1% | ≤10% | Deep integrations aid retention |
| B2C SaaS | 0.4%–1% | 6%–8% | Shorter contracts |
| Usage-based / Freemium | 5%–10%+ | 50%+ | Low commitment |
SaaS companies with annual revenues over $10 million average a churn rate of 8.5%, while smaller companies face churn rates exceeding 20%. The median annual gross dollar churn for private SaaS companies is approximately 14%, and median logo churn is about 13%. A “good” annual churn rate for B2B SaaS is generally considered to be below 5%, though an estimated 60–70% of companies fail to meet this benchmark.
Streaming Video
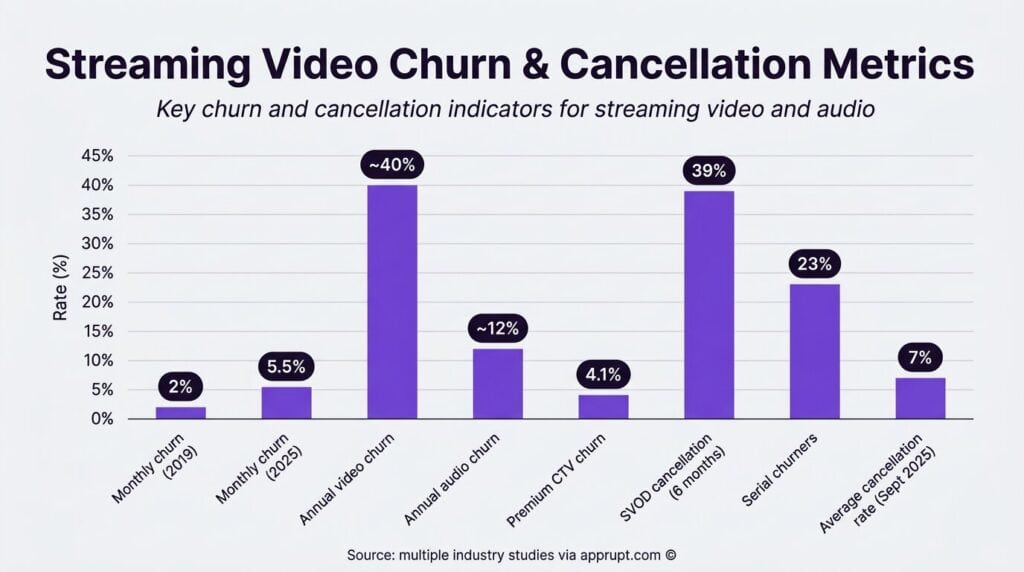
| Metric | Value | Source |
| Monthly churn (2019) | 2% | Industry average |
| Monthly churn (2025) | 5.5% | Industry average |
| Annual video churn | ~40% | Video streaming |
| Annual audio churn | ~12% | Audio streaming |
| Premium CTV churn | 4.1% | Q2 2025 |
| SVOD cancellation (6 months) | 39% | Deloitte 2025 |
| Serial churners | 23% | U.S. streaming audience |
| Average cancellation rate (9 services, Sept 2025) | 7% | Antenna data |
Spotify leads retention with a monthly churn below 1.5%. Subscription prices surged by 25% in the past year, with platforms increasing rates by an average of 9% annually. Disney+ cancellation rates doubled to 8% (from 4%) and Hulu to 10% (from 5%) during a controversy in September 2025.
Mobile Apps
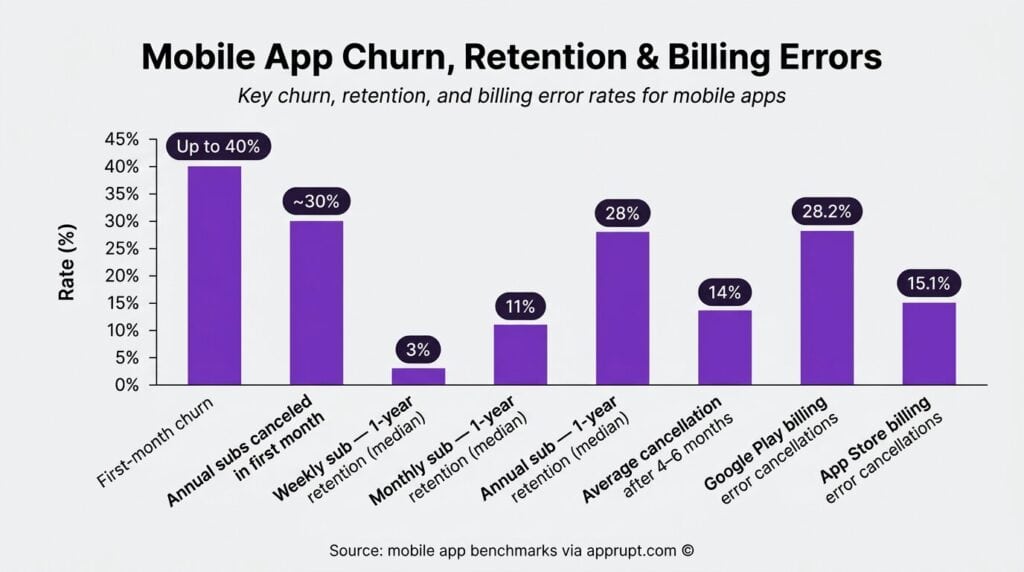
| Metric | Value |
| First-month churn | Up to 40% |
| Annual subs canceled in first month | ~30% |
| Weekly sub — 1-year retention (median) | 3% |
| Monthly sub — 1-year retention (median) | 11% |
| Annual sub — 1-year retention (median) | 28% |
| Average cancellation after 4–6 months | 14% |
| Google Play billing error cancellations | 28.2% |
| App Store billing error cancellations | 15.1% |
The top cancellation reasons for app subscriptions by region show that “not enough usage” leads in North America (38.7%) and India/SEA (40.8%), while cost concerns lead in Latin America (35.3%) and the Middle East & Africa (34.9%).
Fitness / Gym Memberships
Approximately 50% of gym members cancel within the first six months. The annual retention rate stands at about 66.4%, meaning roughly one in three members cancels each year. Cost remains the top driver at 41%, followed by personal circumstances (25%) and belief they can exercise alone (19%).
Meal Kit Services
Meal kit companies have among the highest churn rates of any subscription category. In 2022, about 90% of customers at the five major meal delivery services canceled by the end of the year. Leading meal kit companies have customer retention rates of less than 20%. Multiple companies (Blue Apron, Daily Harvest, The Cumin Club) have moved away from rigid subscription models in response.
Cross-Industry Comparison
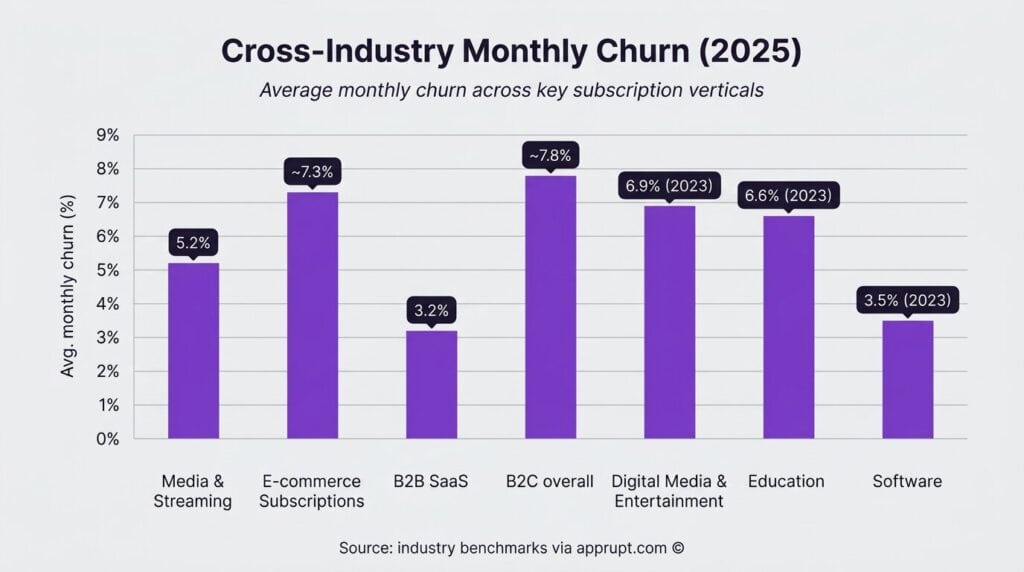
| Industry | Avg. Monthly Churn (2025) | Notes |
| Media & Streaming | 5.2% | Improved from 6.4% peak in 2023 |
| E-commerce Subscriptions | ~7.3% | — |
| B2B SaaS | 3.2% | Most stable category |
| B2C overall | ~7.8% | Greater volatility |
| Digital Media & Entertainment | 6.9% (2023) | Highest among tracked categories |
| Education | 6.6% (2023) | Second highest |
| Software | 3.5% (2023) | Lowest in 2023 |
Involuntary Churn: The Hidden Revenue Leak
Involuntary churn — caused by payment failures rather than conscious cancellation decisions — accounts for 20–40% of all subscription churn. It represents a massive, often overlooked revenue leak.
Scale of the Problem
- 10–15% of all recurring subscription payments fail on the initial attempt.
- Failed payment management could prevent an estimated $129 billion in losses across the subscription industry.
- The average subscription business loses 9% of its monthly recurring revenue to involuntary churn before recovery efforts.
- 48% of subscribers would cancel their service due to billing or payment issues.
- In subscription retail, 50% of churn results from declined card payments.
- 27% of subscribers cancel immediately after a payment failure due to frustration.
Payment Failure Causes
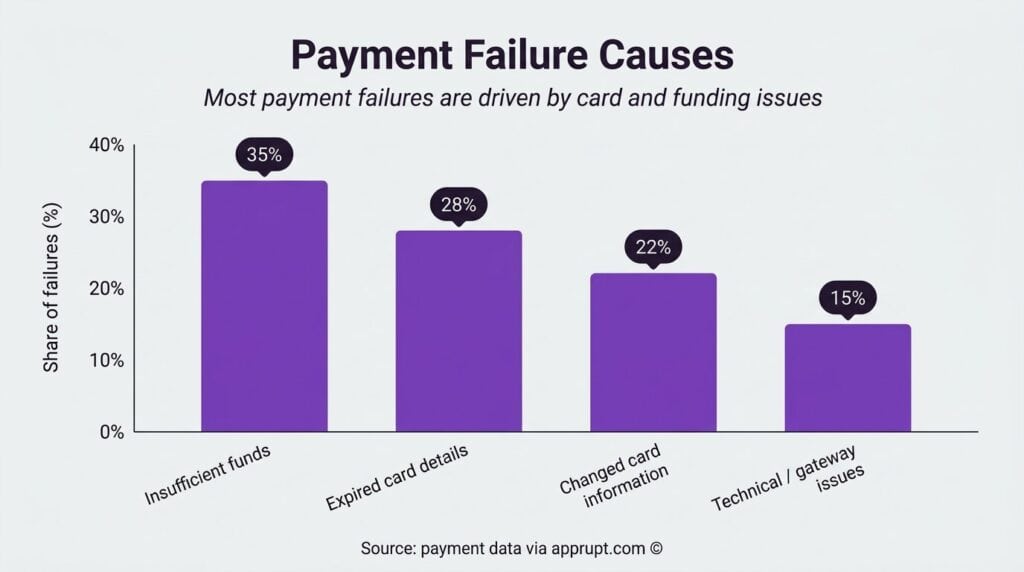
| Cause | Share of Failures |
| Insufficient funds | 35% |
| Expired card details | 28% |
| Changed card information | 22% |
| Technical / gateway issues | 15% |
Expired credit cards are the single largest driver, with roughly 25–30% of cards on file expiring each year. Network and processing errors account for 5–10% of failures but have recovery rates above 90% when retried quickly.
Retention, Win-Back, and Resubscription
Cancellation Flow Effectiveness
- 34% of churned subscribers say a discount would have kept them, and another 34% cite lower pricing as a retention lever.
- 82% of consumers say they are more likely to subscribe when cancellation is easy.
- 58% have paused a subscription instead of canceling when given the option.
- Only 37% of subscribers report having pause options, yet businesses that offer pausing see 25% of would-be churners pause instead of cancel, generating over $200 million in re-subscription revenue.
- Retaining a customer costs 5 to 25 times less than acquiring a new one.
Win-Back and Resubscription
In streaming, 30% of Premium SVOD gross additions in 2023 were resubscribers — users who had previously canceled the same service. Apple TV+ had the highest resubscription rate at 37.2%.
Win-back rates over time show strong recovery potential:
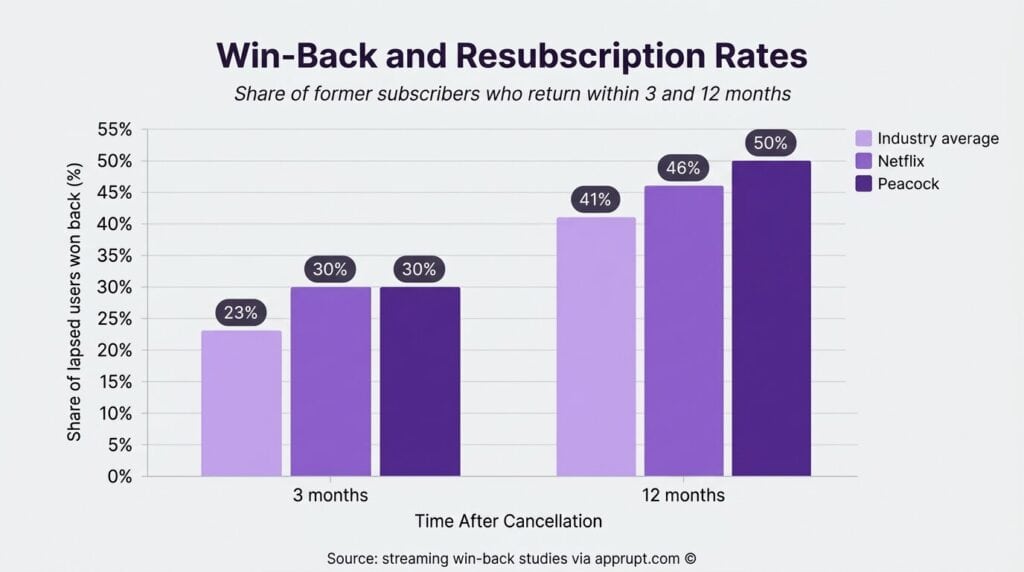
| Time After Cancellation | % Won Back (Industry Avg) | Netflix | Peacock |
| 3 months | 23% | 30% | 30% |
| 12 months | 41% | 46% | 50% |
Across subscription industries, the Return Acquisition Percentage (RAP) is strongest in digital media (24.3%) and travel, hospitality, and entertainment (22.9%). Acquisition rates dropped from 4.1% to 2.8% between 2021 and 2024, making win-back campaigns increasingly essential.
Subscription Fatigue and Price Sensitivity
Subscription fatigue has become a measurable macro-consumer behavior rather than anecdotal sentiment. Key data points:
- 47% of consumers say they pay too much for streaming services.
- 41% say streaming content is not worth the price.
- 60% would cancel their favorite SVOD service after a $5 price increase.
- 42% of subscribers feel they have too many streaming subscriptions, leading nearly half to plan cancellations within the next year.
- 90% of consumers noticed a price hike in the past year, but only 58% felt it was justified.
- 32% say subscriptions now represent over half their discretionary spending.
- Nearly one in five (19.9%) don’t even know how many subscriptions they’re paying for.
Despite fatigue, 80% of consumers have no plans to cut back entirely — they are consolidating spending onto fewer, higher-value providers rather than abandoning the subscription model.
Dark Patterns in Cancellation Processes
Difficult cancellation processes remain widespread and damage brand perception significantly:
- The average subscriber encounters 6.2 dark patterns when trying to cancel a subscription.
- It takes an average of 6.7 clicks/taps to navigate from homepage to successful cancellation.
- 76% of U.S. adults believe subscription services intentionally make cancellation difficult.
- 92% would be more likely to switch to a competitor if they feel manipulated.
- 60.4% have avoided signing up for a service because they heard canceling would be difficult.
- An FTC study found 81% of sites and apps use “sneaking” (auto-renewal with no option to disable during sign-up), 70% don’t provide information on how to cancel, and 67% fail to disclose the cancellation deadline.
- A controlled study found dark patterns caused a 28% reduction in user trust and a 54% decrease in usability scores.
Regulatory Landscape
United States
The FTC finalized its “Click-to-Cancel” rule in October 2024, requiring cancellation to be as easy as sign-up. However, the Eighth Circuit Court of Appeals vacated the rule in July 2025 on procedural grounds. Despite this, the FTC continues enforcement through existing laws including ROSCA and Section 5 of the FTC Act.
In January 2026, the bipartisan Unsubscribe Act was introduced in the House, complementing a Senate proposal from July 2025. The FTC reported an average of nearly 70 consumer complaints daily about subscription practices in 2024, up from 42 per day in 2021.
Over half of U.S. states already have laws echoing click-to-cancel principles. California’s Auto-Renewal Law was updated in July 2025 to require online cancellation if signup happened online. Major card networks (Visa, Mastercard) independently require online cancellation options and clear billing disclosures.
Broader Impact
Companies that simplify cancellation often see improved outcomes. The Financial Times found that removing its “call-to-cancel” requirement and implementing an online cancellation journey doubled its save rate from 3% to 6%. Chargebee’s 2025 research confirms that 82% of consumers are more likely to subscribe when they know cancellation is easy — making frictionless exits a competitive advantage.
Conclusion
Subscription cancellation statistics paint a picture of an industry at an inflection point. The market is growing rapidly, yet consumers are increasingly selective, intentional, and price-sensitive. Over half cancel at least one subscription yearly, streaming churn has nearly tripled since 2019, and involuntary churn from payment failures costs the industry an estimated $129 billion. The most effective retention strategies center on flexibility (pause options, easy cancellation), transparent pricing, personalized incentives at the point of cancellation, and robust payment recovery systems. Regulatory momentum toward easier cancellation is accelerating, and data consistently shows that brands making it easy to leave are the ones consumers choose to stay with.