Global streaming has entered a new phase defined by maturation in Western markets and explosive growth in emerging regions. As of early 2026, global SVOD subscriptions are projected to reach approximately 1.5 billion — with an average subscriber maintaining 2.14 separate subscriptions. The total is forecast to surpass 1.69 billion by 2027. Netflix leads with 325+ million paid subscribers, while India’s JioHotstar has emerged as a disruptive force with 300 million subscribers in just four months after launch. The U.S. premium streaming market has hit approximately 280 million subscriptions, but growth has decelerated sharply to just 7% year-over-year. The next wave of growth will come from ad-supported tiers, operator-led bundling, and Asia-Pacific expansion — not from adding new subscribers in saturated Western markets.
Global SVOD Subscriber Landscape
Total Global Subscriptions
Digital TV Research projects global SVOD subscriptions will reach approximately 1.5 billion across 138 countries in 2026, rising to 1.69 billion by 2027. This represents a 65% increase from 2020 levels, though the pace of growth has slowed from the pandemic-era peak when 201 million subscriptions were added in a single year.
A key distinction: the number of subscriptions exceeds the number of unique subscribers. The average SVOD subscriber holds 2.14 subscriptions as of 2026, up from 1.74 in 2020. This means approximately 700 million unique individuals were expected to pay for at least one SVOD service by 2026 — representing 39% of all global TV households.
The U.S. and China together account for roughly 48% of global SVOD subscriptions, down from 59% in 2020, as other markets — particularly India, Southeast Asia, and Latin America — are growing faster. Nearly 58% of worldwide digital video viewers are expected to watch subscription OTT streaming services in 2026, with penetration significantly higher in mature markets like Canada (87%).
Combined SVOD and Pay TV
Omdia forecasts that global SVOD and pay TV subscriptions combined will surpass 3 billion by 2027, with SVOD serving as the primary growth engine while pay TV subscriptions remain largely static at approximately 1 billion globally.
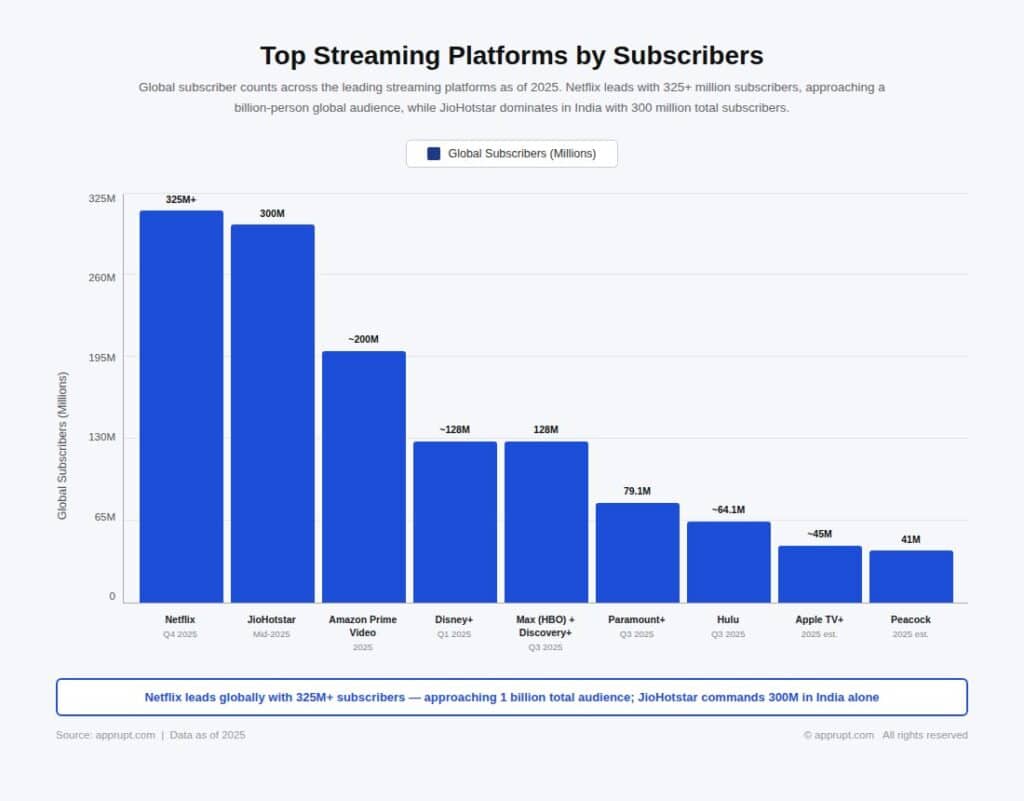
Top Streaming Platforms by Subscribers
| Platform | Global Subscribers | Period | Key Detail |
| Netflix | 325+ million (est. 327.7M) | Q4 2025 | Up 8.6% YoY; approaching 1B global audience |
| JioHotstar | 300 million (India) | Mid-2025 | 100M+ paid; 500M+ total users |
| Amazon Prime Video | ~200 million | 2025 | 315M monthly viewers globally |
| Disney+ | ~125–132 million | Q1 2025 | 195.7M combined with Hulu |
| Max (HBO) + Discovery+ | 128 million | Q3 2025 | Targeting 150M+ by end 2026 |
| Paramount+ | 79.1 million | Q3 2025 | +14% YoY; ARPU $8.40 |
| Hulu | ~64.1 million | Q3 2025 | 77% of Disney+ subs via bundles |
| Apple TV+ | ~45 million | 2025 est. | Never officially disclosed |
| Peacock | 41 million | 2025 est. | ARPU $10.02 |
Netflix: Still the Global Leader
Netflix crossed 325 million paid subscribers worldwide in Q4 2025, up from 301.2 million a year prior. S&P Global estimates the actual end-of-quarter figure was 327.7 million. Asia-Pacific subscribers grew at the fastest rate (13.5%), while Europe, Middle East, and Africa accounted for the largest regional share at 33% of total global subscribers.
Netflix’s full-year 2025 revenue reached $45.2 billion, with an operating margin of 29.5%. The company targets $50.7–51.7 billion in revenue for 2026, with content amortization growth of approximately 10% pushing content spending to an estimated $20 billion. Netflix stopped reporting subscriber numbers quarterly in 2025 but indicated it would share milestone updates.
JioHotstar: India’s Streaming Phenomenon
Perhaps the most dramatic subscriber story of 2025 involves India’s JioHotstar, born from the $8.5 billion merger of Reliance Industries’ Viacom18 and Disney’s Star India. Launching on February 14, 2025, with approximately 45–50 million subscribers, the platform raced to 100 million paid subscribers within just six weeks. By mid-2025, it reached 300 million total subscribers, propelled by the 2025 IPL cricket season which drew 652 million digital viewers.
As of early 2026, JioHotstar has over 100 million paid subscribers and a total user base exceeding 500 million. It holds a commanding 31% share of India’s SVOD market and 56% of premium VOD consumption hours in India. HSBC estimates JioHotstar had 300 million paying subscribers in 2025, compared to 65 million for Amazon Prime Video and just 20 million for Netflix in India.
Disney+, Max, and Paramount+
Disney+ reported 131.6 million subscribers in Q3 2025 (195.7 million combined with Hulu), adding 3.8 million in the quarter. Warner Bros. Discovery’s Max and Discovery+ reached 128 million globally, with the company on track for at least 150 million by end of 2026. Paramount+ grew 14% year-over-year to 79.1 million subscribers with an 11% rise in average revenue per user to $8.40.
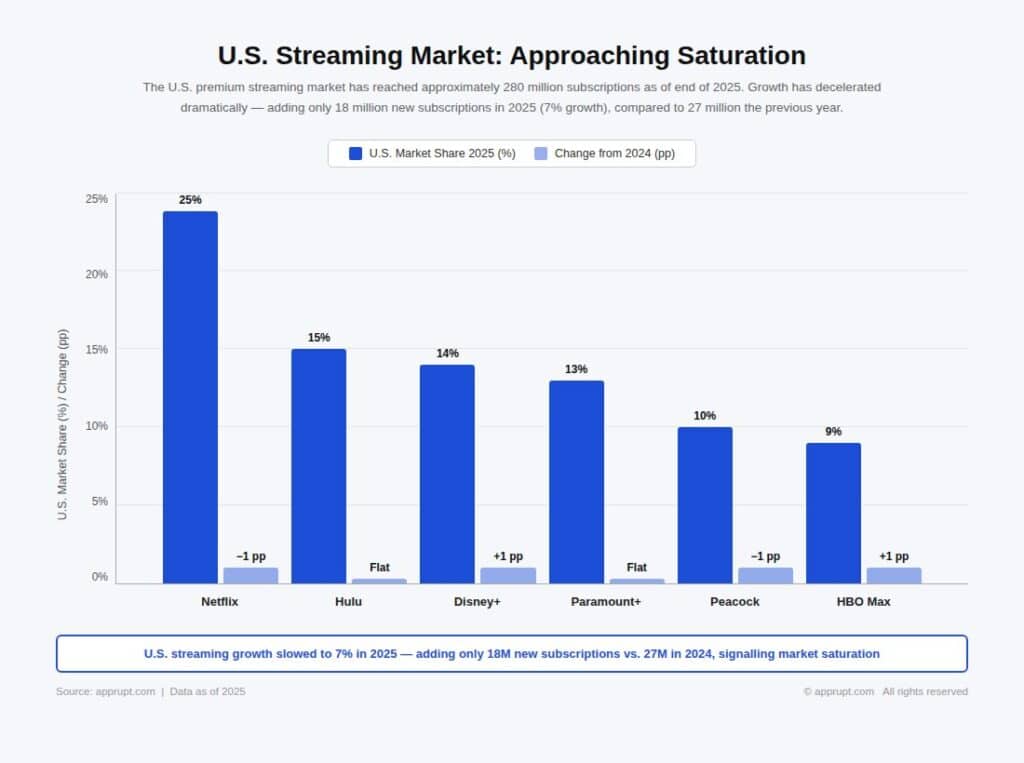
U.S. Streaming Market: Approaching Saturation
The U.S. premium streaming market has reached approximately 280 million subscriptions as of the end of 2025. However, growth has decelerated dramatically — adding only 18 million new subscriptions in 2025 (7% growth), compared to 27 million the previous year.
| Platform | U.S. Market Share (2025) | Change from 2024 |
| Netflix | 25% | −1 pp |
| Hulu | 15% | Flat |
| Disney+ | 14% | +1 pp |
| Paramount+ | 13% | Flat |
| Peacock | 10% | −1 pp |
| HBO Max | 9% | +1 pp |
Including niche, specialty, and sports-only streamers, the total U.S. SVOD subscription base reached nearly 339 million by mid-2025, representing 9.5% year-over-year growth — well below the double-digit surges of prior years. Specialty streamer growth decelerated sharply to 12% from 22% a year earlier, while sports-only streamers actually declined by about 1%.
The average American household maintains approximately four SVOD subscriptions, a number that Deloitte predicts has peaked. In Europe, the average plateaued at 2.35 subscriptions per household in both 2023 and 2024.
Ad-Supported Streaming: The Primary Growth Engine
The most significant structural shift in streaming is the accelerating adoption of ad-supported tiers. This represents the industry’s pivot from subscriber acquisition to monetization depth.
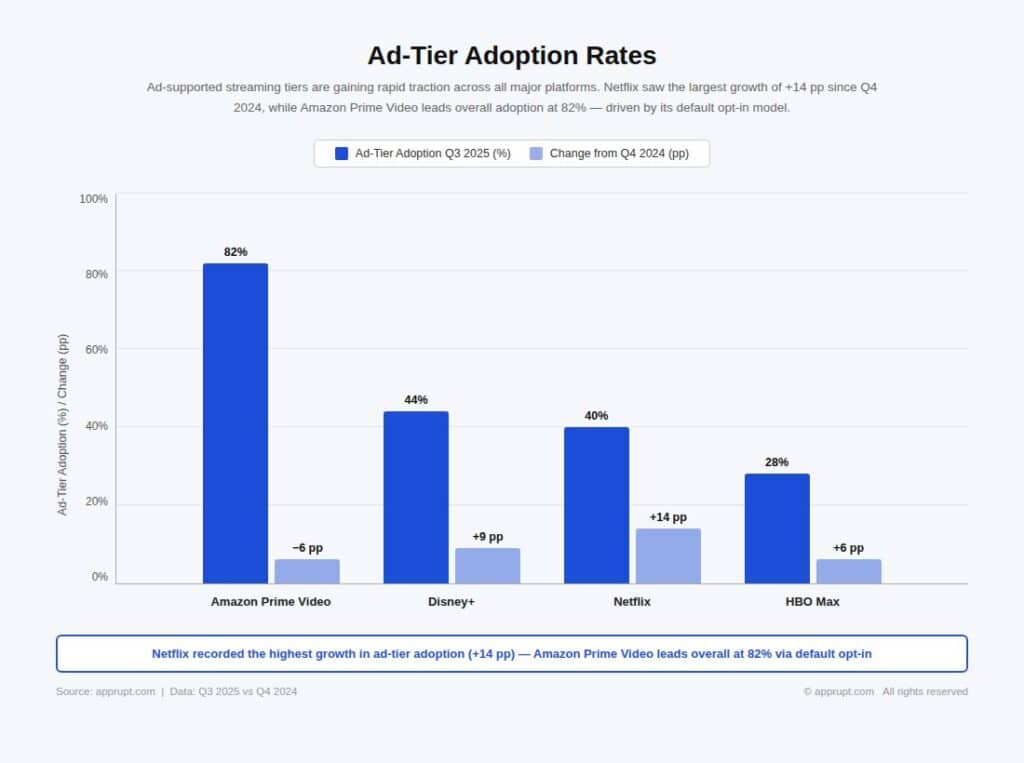
Ad-Tier Adoption Rates
| Platform | Ad-Tier Adoption (Q3 2025) | Change from Q4 2024 |
| Amazon Prime Video | 82% | −6 pp (default opt-in) |
| Disney+ | 44% | +9 pp |
| Netflix | 40% | +14 pp |
| HBO Max | 28% | +6 pp |
Netflix’s ad-tier growth is particularly notable: 40% of all active Netflix accounts globally now use the ad-supported Standard with Ads plan, up from 26% just one year earlier. In the U.S. specifically, Comscore data shows that 45% of Netflix household viewing hours now occur on the ad-supported tier, up from 34% in 2024. Netflix has reported 190 million monthly active viewers on its ad tier.
Across the industry, 71% of new streaming subscribers choose ad-supported plans over premium ad-free options. Over 50% of the U.S. population is expected to watch content from at least one ad-supported streaming service monthly by 2026.
AVOD Market Size
The global advertising-based video on demand (AVOD) market was valued at $54.14 billion in 2025 and is projected to reach $218.31 billion by 2033, growing at a CAGR of 19.12%. The U.S. AVOD market alone was valued at $18.52 billion in 2025 and is projected to reach $73.42 billion by 2033. Premium AVOD platform revenue grew 39% to $14.3 billion in 2024, with projected growth of 17% in 2025 to exceed $15 billion.
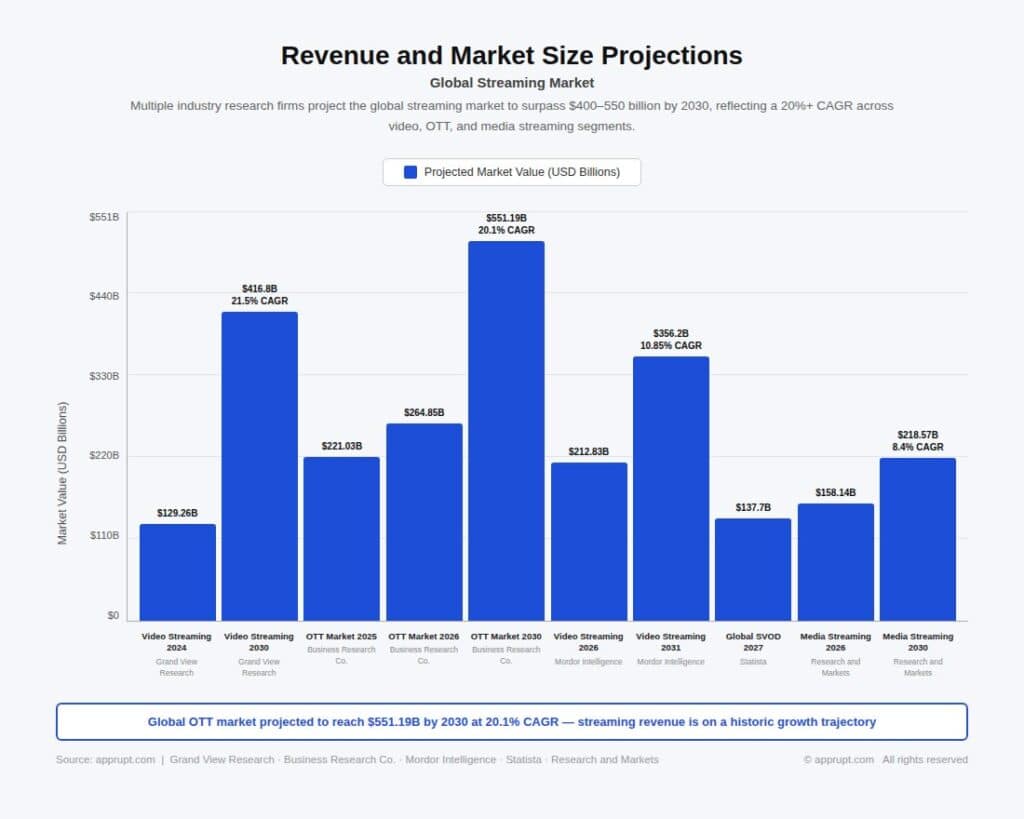
Revenue and Market Size Projections
Global Streaming Market
| Metric | Value | Source |
| Video streaming market (2024) | $129.26 billion | Grand View Research |
| Video streaming market (2030) | $416.8 billion (21.5% CAGR) | Grand View Research |
| OTT streaming market (2025) | $221.03 billion | Business Research Co. |
| OTT streaming market (2026) | $264.85 billion | Business Research Co. |
| OTT streaming market (2030) | $551.19 billion (20.1% CAGR) | Business Research Co. |
| Video streaming market (2026) | $212.83 billion | Mordor Intelligence |
| Video streaming market (2031) | $356.2 billion (10.85% CAGR) | Mordor Intelligence |
| Global SVOD revenue (2027) | $137.7 billion | Statista |
| Media streaming market (2026) | $158.14 billion | Research and Markets |
| Media streaming market (2030) | $218.57 billion (8.4% CAGR) | Research and Markets |
Note: Market size estimates vary widely depending on what each research firm includes (SVOD only vs. all OTT vs. total video streaming including live). The OTT streaming market encompassing all segments is the broadest definition, while SVOD revenue is the narrowest.
Platform-Level Revenue
Netflix dominates streaming revenue, generating $45.2 billion in full-year 2025 revenue with a 29.5% operating margin. The company projects $50.7–51.7 billion for 2026. Netflix’s Q4 2025 revenue of $12.01 billion represented 17.6% year-over-year growth.
Disney+ and Hulu collectively produced $1.3 billion in operating profit for fiscal 2025 (compared to $143 million in fiscal 2024), a turnaround driven by price increases, subscriber additions, and the exit from Star India. Disney anticipates $375 million in streaming profit from Disney+ and Hulu for Q1 fiscal 2026 alone. Paramount+’s streaming division recorded a $340 million profit in Q3 2025, up from $49 million a year prior.
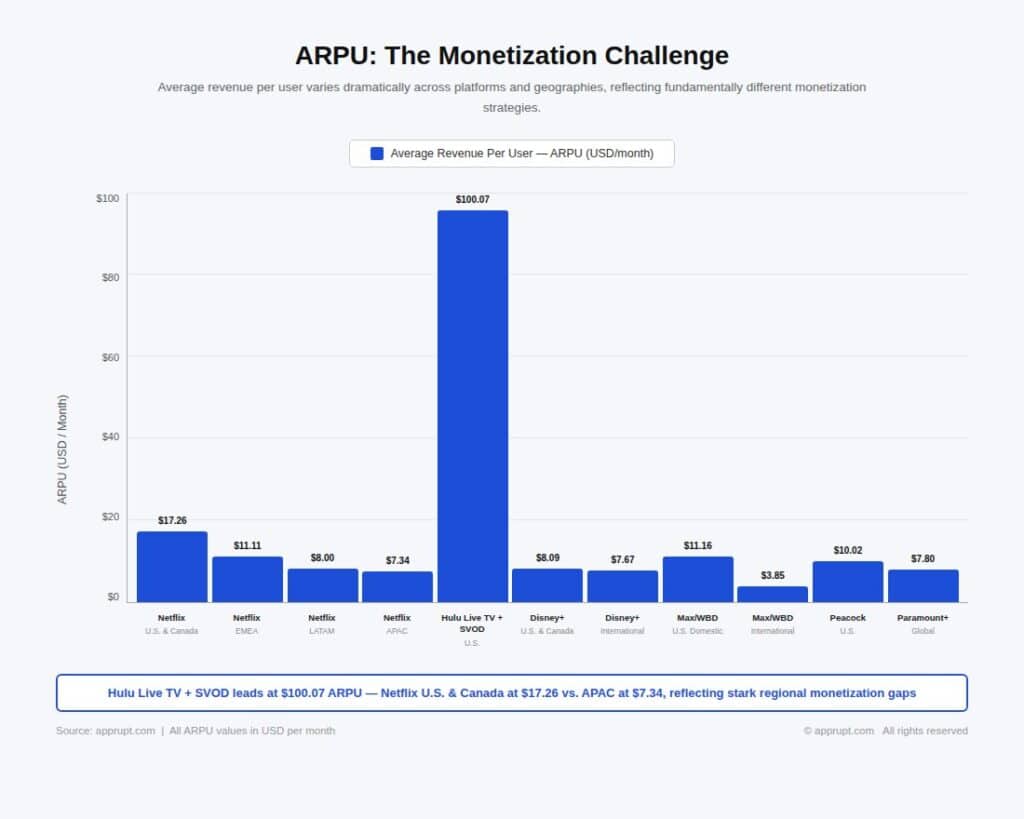
ARPU: The Monetization Challenge
Average revenue per user varies dramatically across platforms and geographies, reflecting fundamentally different monetization strategies.
| Platform | Region | ARPU | Model |
| Netflix | U.S. & Canada | $17.26 | Subscription + Ads |
| Netflix | EMEA | $11.11 | Subscription + Ads |
| Netflix | LATAM | $8.00 | Subscription + Ads |
| Netflix | APAC | $7.34 | Subscription + Ads |
| Hulu Live TV + SVOD | U.S. | $100.07 | Full bundle |
| Disney+ | U.S. & Canada | $8.09 | Subscription + Ads |
| Disney+ | International | $7.67 | Subscription + Ads |
| Max/WBD | U.S. (Domestic) | $11.16 | Subscription + Ads |
| Max/WBD | International | $3.85 | Subscription + Ads |
| Peacock | U.S. | $10.02 | Subscription + Ads |
| Paramount+ | Global | $7.80 | Subscription + Ads |
Despite price increases across OTT services over the past 12 months, many platforms have seen year-over-year ARPU remain flat or decline due to wholesale pricing deals, increasing ad-tier adoption (which carries lower ARPU than premium tiers), and promotional offers. Disney and Netflix have both stopped reporting certain ARPU metrics, reflecting the complexity of measuring monetization in a hybrid subscription-advertising model.
Asia-Pacific: The Next Growth Frontier
Asia-Pacific is the fastest-growing streaming region globally, with a projected 16.8% CAGR through 2031. Media Partners Asia projects the region’s total screen revenues will reach $196 billion by 2030, with all net growth coming from online video.
India: Emerging as the World’s Largest SVOD Market
India is projected to overtake China as the largest SVOD market by subscriber count by 2030, reaching 358 million subscriptions. However, India’s premium VOD revenue will still be 4.5x smaller than China’s and 2.5x smaller than Japan’s, reflecting significantly lower ARPU.
The Indian streaming market recorded 21.5 billion hours of premium VOD consumption in Q2 2025 alone. JioHotstar dominates with a 56% viewing share, followed by Amazon’s Prime Video and MX Player at 25% combined. Cricket — particularly the IPL — remains the primary driver of engagement and subscriber acquisition.
Content Investment Shift
In a landmark development, streaming platforms overtook traditional pay TV as the largest source of content investment in Asia-Pacific for the first time in 2025. Premium VOD is projected to add $12.5 billion in incremental revenue between 2025 and 2030, reaching $52 billion. Traditional TV revenues, conversely, are expected to decline by $8 billion cumulatively, with China, Japan, and India accounting for nearly 70% of the loss.
Bundling: The New Distribution Model
Bundling has become a critical growth and retention strategy as subscriber acquisition slows.
Bundle subscribers in the U.S. grew 40% in 2025 to 71 million, now accounting for 27% of all streaming subscriptions. Disney+ has been the largest beneficiary, with 77% of its U.S. subscriptions coming through bundles. Globally, operator-led bundles (where telecom companies manage acquisition, onboarding, and billing for streaming services) account for approximately 365 million SVOD subscriptions — about 20% of the global streaming market. By 2029, this figure is projected to reach 540 million, or nearly a quarter of all subscriptions.
The retention benefits are substantial: subscribers to the Disney+/Hulu/ESPN+ bundle are 59% less likely to churn than those subscribing to Disney+ alone. This addresses one of the industry’s persistent challenges — U.S. streaming churn remains elevated at approximately 40%, compared to about 20% in the UK.
Deloitte projects that 25% of all online video subscriptions globally will be sourced through telecom operators by 2028, up from 20% in 2023. As standalone subscriptions approach peak stacking, these bundled distribution channels represent the primary path for incremental growth.
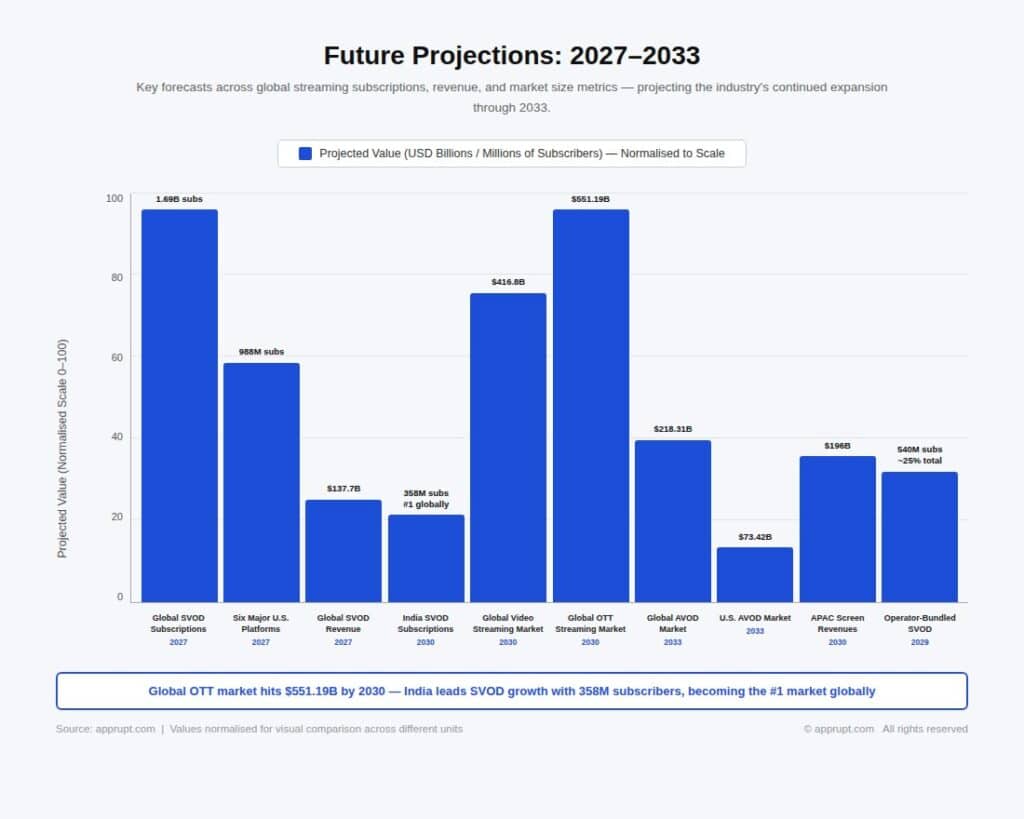
Future Projections: 2027–2033
| Metric | Projection | Timeline |
| Global SVOD subscriptions | 1.69 billion | 2027 |
| Six major U.S. platforms (combined subs) | 988 million | 2027 |
| Global SVOD revenue | $137.7 billion | 2027 |
| India SVOD subscriptions | 358 million (#1 globally) | 2030 |
| Global video streaming market | $416.8 billion | 2030 |
| Global OTT streaming market | $551.19 billion | 2030 |
| Global AVOD market | $218.31 billion | 2033 |
| U.S. AVOD market | $73.42 billion | 2033 |
| APAC screen revenues | $196 billion | 2030 |
| Operator-bundled SVOD subs | 540 million (~25% of total) | 2029 |
The streaming industry’s growth trajectory through the end of the decade will be shaped by several converging forces: the shift from subscriber count to revenue-per-subscriber as the key metric; the rise of advertising as the dominant growth engine; the expansion of bundled distribution through telecom and media aggregators; and the emergence of India and Southeast Asia as the largest incremental subscriber pools. YouTube on the television set is expected to see viewing increase by 90% between 2024 and 2029, further fragmenting the competitive landscape. While the total addressable market continues to expand, the era of rapid double-digit subscriber growth in mature Western markets has decisively ended, replaced by a more nuanced competition for viewer time, advertising dollars, and bundling partnerships.