Connected TV (CTV) advertising is one of the fastest-growing segments of the global advertising market. U.S. CTV ad spend reached $33.35 billion in 2025 and is projected to hit approximately $38 billion in 2026, with growth rates easing from 14% in 2026 to 11% annually through 2029. The global CTV advertising platforms software market is projected to reach approximately $70 billion by 2033, growing at a 25% CAGR. By 2028, CTV ad spending is expected to surpass traditional linear TV for the first time, and by 2030, CTV is forecasted to command over 40% of global ad spending. The channel is being reshaped by the rise of ad-supported streaming tiers, retail media integration, programmatic buying, and AI-driven targeting — though challenges around ad fraud, measurement, and transparency persist.
U.S. CTV Ad Spend: Historical and Projected
The U.S. market dominates global CTV advertising, having grown more than fourfold since 2020.
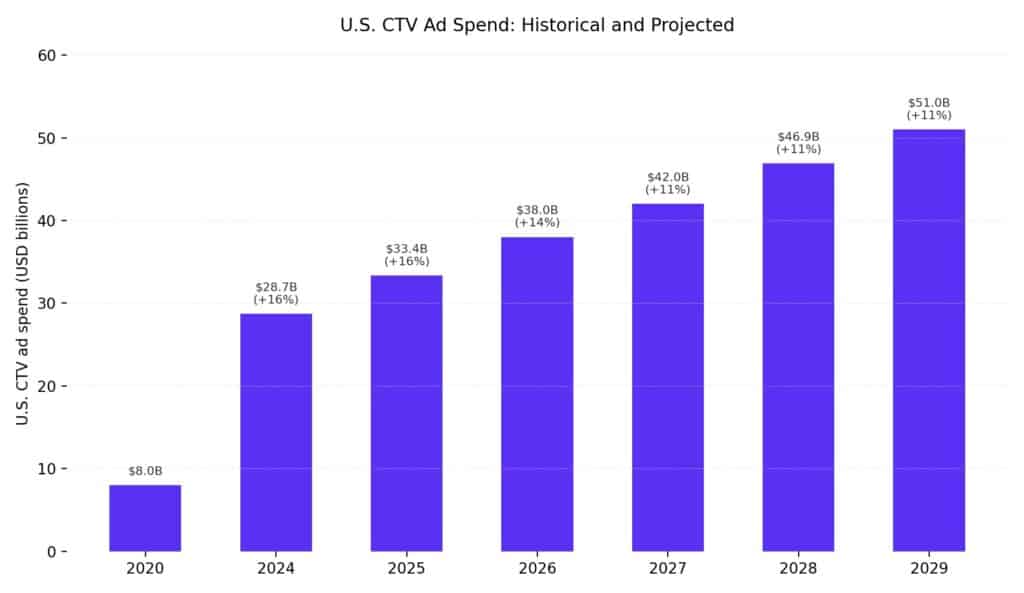
| Year | U.S. CTV Ad Spend | YoY Growth |
| 2020 | ~$8 billion | — |
| 2024 | $28.6–$28.79 billion (actual) | +16% |
| 2025 | $33.35 billion | +16% |
| 2026 | ~$38 billion (projected) | +14% |
| 2027 | ~$42 billion (projected) | +11% |
| 2028 | $46.89 billion (projected) | +11% |
| 2029 | ~$51 billion (projected) | +11% |
CTV is adding nearly $20 billion in new U.S. ad dollars over the next five years. Even as growth rates moderate from the 30–40% hypergrowth seen in 2019–2021, CTV still outpaces total U.S. advertising growth of 5–7% annually.
Global CTV Advertising Revenue
Global CTV advertising revenue was forecast at $35.2 billion in 2024, a nearly 20% increase over the prior year. By 2026, global CTV ad spend is projected to reach $46.3 billion. BCG estimates current global CTV ad spending at $40–$45 billion, with growth rates of around 12% over the next three years.
The global CTV advertising platforms software market — covering DSPs, SSPs, and ad tech infrastructure — was estimated at $15 billion in 2025 and is projected to reach approximately $70 billion by 2033, growing at a CAGR of 25%.
The free ad-supported streaming TV (FAST) market is also experiencing rapid growth. It was valued at $9.73 billion in 2024 and is projected to reach $40.20 billion by 2033, at a CAGR of 16.9%.
CTV vs. Traditional TV: The Crossover
CTV is on a clear trajectory to overtake traditional linear TV advertising. The most significant projected milestone: CTV ad spending will surpass traditional TV ad spending for the first time in 2028, when CTV is expected to reach $46.89 billion while traditional TV falls to approximately $45 billion.
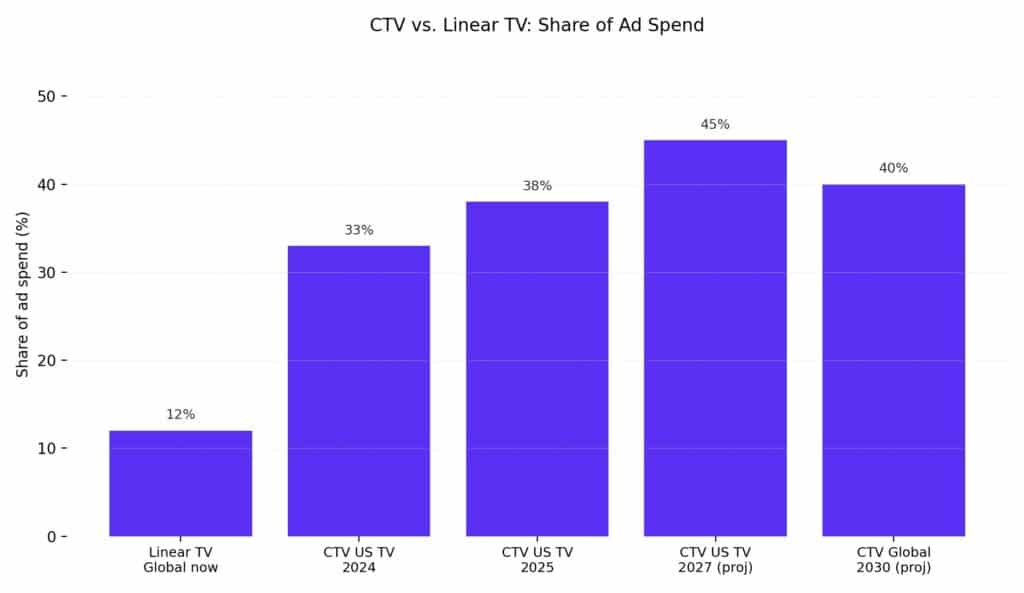
| Metric | Value | Source |
| Linear TV share of global ad spend | 12% (declining) | |
| CTV projected share by 2030 | >40% of global ad spend | |
| CTV share of U.S. TV ad spend (2024) | ~33% ($29B of $88B) | |
| CTV share of U.S. TV ad spend (2025) | ~38% ($33B of $88B) | |
| CTV share of U.S. TV ad spend (2027 projected) | ~45% ($42B of $93B) | |
| CTV projected to reach 50% of TV ad spend | 2029–2030 |
Streaming surpassed cable and broadcast combined in terms of share of TV viewership by mid-2025. As of March 2025, streaming represented 43.8% of overall TV time in the U.S., up 10 points in two years.
CTV Viewership and Household Penetration
CTV adoption in the U.S. has reached near-universal levels.
- 90% of U.S. households had CTV devices in 2025
- 250 million+ Americans watch CTV content
- 234 million individual CTV viewers in the U.S. in 2024, representing 70.5% of the population
- 115 million U.S. households (88%) owned at least one CTV device as of 2024
- 96.4 million connected-TV households measured by Comscore in 2025
- Streaming accounts for 43.8% of total TV viewing time (March 2025)
- 72.4% of U.S. TV viewing time is ad-supported
- 96% of Roku households view video ads
Device Penetration
| Platform | User Base |
| Roku | 85.5–90 million streaming households |
| Amazon Fire TV | 70+ million active users globally |
| Smart TVs | Primary CTV access point for most households |
CTV penetration has grown from approximately 60% in 2018 to 75% in 2020, 85% in 2022, and 90% in 2025, with saturation levels of 95%+ expected in coming years.
Market Share by Platform (2026)
The CTV advertising market is highly fragmented. Only three companies are expected to capture more than 10% of U.S. CTV ad sales in 2026.
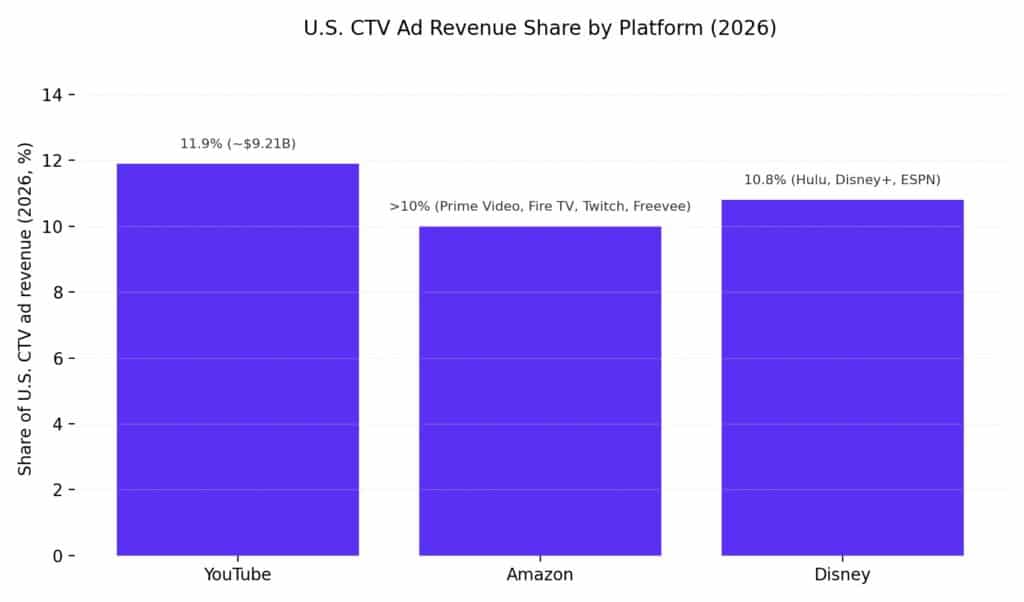
| Platform | Share of U.S. CTV Ad Revenue (2026) | Key Properties |
| YouTube | 11.9% (~$9.21B net CTV ad sales) | YouTube on TV screens |
| Amazon | >10% | Prime Video, Fire TV, Twitch, Freevee |
| Disney | 10.8% | Hulu, Disney+, ESPN |
YouTube accounts for roughly 12.5% of U.S. TV usage across all streaming platforms, ahead of Netflix and Prime Video. On the Roku platform specifically, Hulu led with $77 million in monthly ad revenue in 2025, followed by FAST apps Pluto TV and Tubi at $3 million and $2 million respectively.
CTV Ad Performance Metrics
CTV advertising delivers significantly stronger engagement and completion rates compared to other digital channels.
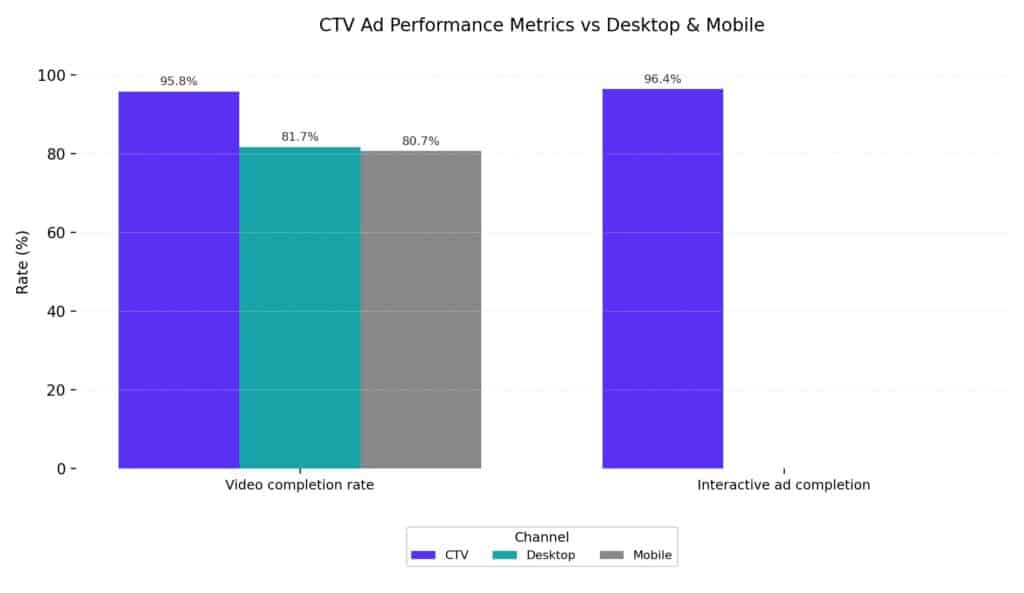
| Metric | CTV | Desktop | Mobile |
| Video completion rate | 95.80% | 81.70% | 80.70% |
| Interactive ad completion | 96.4% | — | — |
Source: Innovid 2024 Global Benchmarks Report
Additional performance benchmarks:
- Ad viewability rates on CTV exceed 97%
- CTV drives 20% higher brand recall than mobile video ads
- 23% higher ROI than traditional TV advertising
- Interactive CTV ads see 3–5x higher engagement than standard video ads
- Shoppable CTV ads convert 5x better than standard video ads
- CTV contributes to a 15% lift in overall marketing campaign performance
- 74% of consumers are open to watching ads if the content is free
- Average CTV CPMs: $25–$40 for most advertisers; premium targeting can push CPMs to $35–$65
Completion Rates by Ad Duration
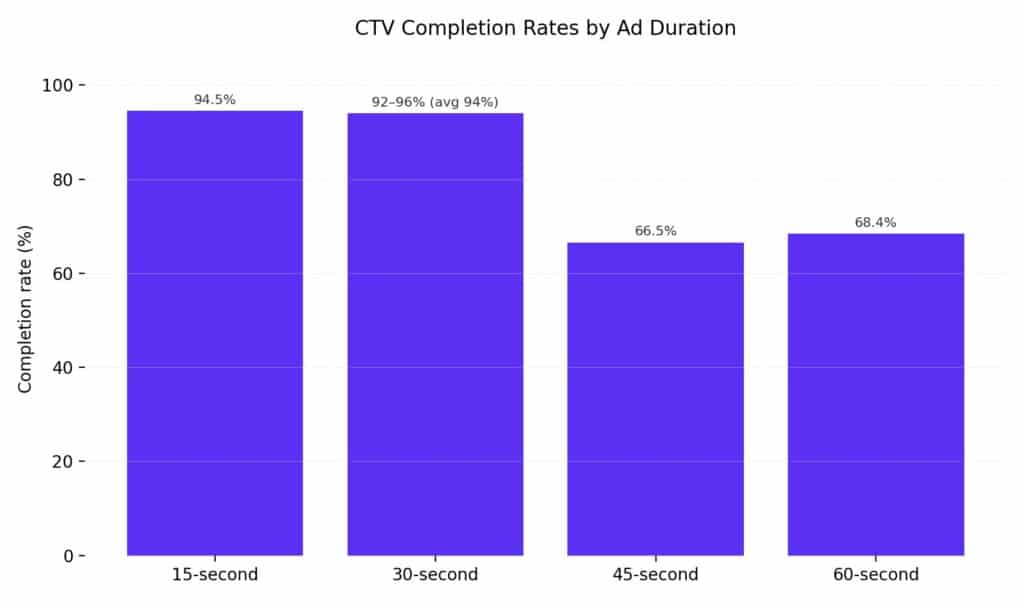
| Ad Length | Completion Rate |
| 15-second | 94.5% |
| 30-second | 92–96% |
| 45-second | 66.5% |
| 60-second | 68.4% |
Source: IAB/Innovid research
Programmatic CTV Advertising
Programmatic buying is rapidly expanding within CTV, lowering barriers to entry for smaller advertisers.
- 50% of CTV/OTT advertising is expected to be purchased programmatically in 2026
- 70% of CTV advertisers plan to boost spending in 2026
- 14% YoY rise in unique advertisers leveraging programmatic CTV delivery
- CTV ad spend grew 100%+ from 2022 to 2024 as measured by programmatic impressions
- New-to-programmatic advertisers achieved 29% more ad views than those who entered in early 2024
- 58% of media buyers expect programmatic investment to increase in 2026
- Programmatic buying will account for 90% of global digital display ad spending by 2026
CTV ad views on devices grew 8% YoY in the U.S. and 31% in Europe in 2025. Programmatic access has opened CTV to smaller advertisers who were once confined to search and social channels.
Retail Media on CTV
Retail media networks (RMNs) represent one of the fastest-growing subsegments within CTV advertising.
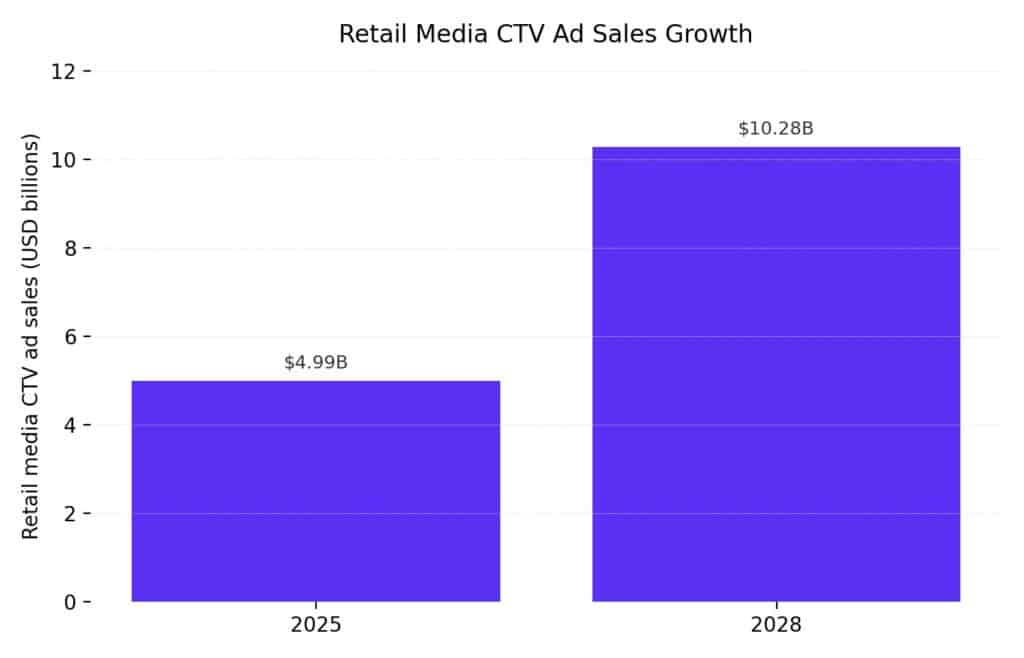
| Year | Retail Media CTV Ad Sales |
| 2025 | $4.99 billion |
| 2028 | $10.28 billion |
Source: MNTN Research/eMarketer
- Retail media CTV ad spending grew 45.5% in 2025
- One in five CTV ad dollars is projected to go to retail media by 2027
- U.S. retail media ad spend overall is expected to reach $69.33 billion in 2026
- Amazon Ads and Walmart Connect are capturing much of the incremental retail media spend
The convergence of commerce and television advertising is accelerating as retail data integrations allow advertisers to connect streaming ad exposure directly to purchase behavior.
Advertiser Sentiment and Budget Shifts
Advertiser enthusiasm for CTV continues to grow across multiple survey indicators.
- 70% of CTV advertisers plan to boost spending in 2026
- 56% of global marketers plan to increase OTT and CTV spending, up from 53% the prior year
- 53% of marketers say CTV is more “brand-safe” than social media
- 92% of Indian marketers expect video budgets to increase in the coming year
- Up to 50% of streaming advertisers may subsidize CTV ad spend increases with budgets siphoned from search and social in 2026
- Nearly 40% of U.S. marketers have reallocated budgets from non-video digital ads in favor of CTV
India and Asia-Pacific CTV Market
India
India’s CTV advertising market is in a high-growth early stage, fueled by smart TV adoption and broadband expansion.
- CTV ad spend: INR 450 crore (2022) → INR 1,500 crore (2024) → projected INR 3,500 crore by 2027
- CTV share of India’s TV ad spend: 4.4% currently, 35% projected by 2026, 42% by 2027
- 129.2 million active CTV users across 60–70 million CTV homes, with 87% YoY growth since 2024
- 91% of Indian viewers engage with ads while watching content
- Sales of 55-inch+ smart TVs grew 43% in 2024 in India
- India’s OTT video market size is estimated to reach $7 billion by 2027, with IMARC projecting over $27 billion by 2033
- WPP Media estimates CTV’s share of TV/professional video ad spend in India will increase to 17% in 2026
Asia-Pacific
The digital ad spend market in Asia-Pacific is expected to grow by 14.1% annually, reaching $311.4 billion by 2026. CTV adoption, retail media growth, and AI-driven campaign management are key drivers. Projections indicate a CAGR of 16.3% from 2026 to 2029, with the market expected to reach approximately $489.3 billion by 2029.
Ad-Supported Streaming Landscape
The expansion of ad-supported tiers across major streaming services has dramatically increased available CTV advertising inventory.
- Streaming surpassed cable and broadcast combined in TV viewership by mid-2025
- 72.4% of all U.S. TV viewing time is now ad-supported
- 84.7% of subscription-based OTT ad sales will originate from CTV in 2026, totaling $16.23 billion
- 74% of consumers are open to watching ads if the content is free
- 23% of Indians are now digital-only viewers, with the number expected to grow
- Netflix, Disney+, Amazon Prime Video, and Max have all launched and expanded ad-supported tiers, creating massive new premium inventory pools
Challenges: Fraud, Measurement, and Transparency
Despite CTV’s strong growth trajectory, significant challenges remain around ad fraud, measurement, and transparency.
Ad Fraud
- An estimated 30% more CTV inventory is sold than what is actually being watched in the U.S.
- 110% YoY spike in CTV fraud/SIVT (sophisticated invalid traffic) filter rates
- Bot fraud accounted for 65% of all CTV fraud
- 4 million infected CTV bot devices generate extreme volumes of invalid traffic daily
- One bot variant alone has the potential to waste over $7.5 million per month in advertiser budget
- IVT rates are 110% higher when server-side ad insertion (SSAI) is used
Measurement and Transparency
- Only 50% of CTV impressions offered full app transparency in 2024
- 63% of marketers who advertise on CTV say it’s hard to tell if their buys reach real viewers
- 4 out of 10 American marketers cite brand safety as a concern with CTV
- India saw a 60% improvement in CTV fraud-SIVT violation rates, suggesting better filtration but also exposing prior vulnerability
Industry efforts are underway — IAS received MRC accreditation for CTV SIVT filtration in 2024, and cross-platform measurement standards via OpenAP and CFLight are enabling de-duplicated reach metrics. However, device-level transparency, standardised log-level reporting, and consistent verification remain works in progress.
Key Market Forecasts: 2026–2033 Summary
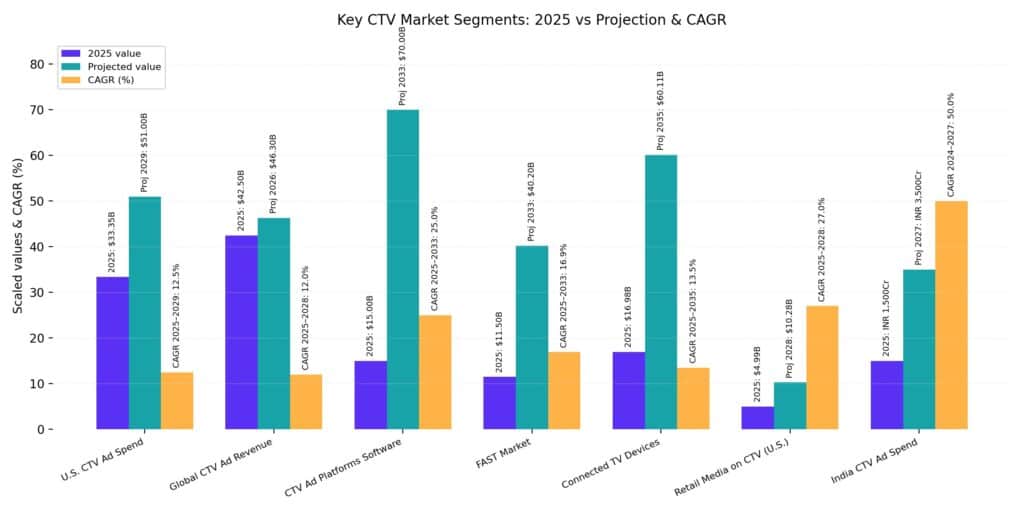
| Segment | 2025 Value | Projected Value | CAGR | Period |
| U.S. CTV Ad Spend | $33.35B | ~$51B (2029) | 11–14% | 2025–2029 |
| Global CTV Ad Revenue | ~$40–45B | $46.3B (2026) | ~12% | 2025–2028 |
| CTV Ad Platforms Software | $15B | ~$70B (2033) | 25% | 2025–2033 |
| FAST Market | $11.50B | $40.20B (2033) | 16.9% | 2025–2033 |
| Connected TV Market (Devices) | $16.98B | $60.11B (2035) | 13.5% | 2025–2035 |
| Retail Media on CTV (U.S.) | $4.99B | $10.28B (2028) | ~27% | 2025–2028 |
| India CTV Ad Spend | INR 1,500Cr | INR 3,500Cr (2027) | ~50% | 2024–2027 |
Outlook
CTV advertising is transitioning from a high-growth disruptor to the dominant mode of television advertising. The structural shift from linear to streaming is irreversible — with CTV projected to surpass traditional TV ad spend by 2028 and command over 40% of global ad spend by 2030. The convergence of retail media, programmatic activation, and AI-driven targeting is expanding CTV’s addressable market beyond traditional TV budgets into search and social allocations. However, the industry must resolve persistent challenges in ad fraud (estimated at 30%+ of inventory), measurement transparency, and cross-platform standardization to fully unlock CTV’s premium value proposition. Markets like India, with 87% YoY CTV user growth, represent the next frontier of expansion — mirroring the trajectory the U.S. followed over the past decade.