The global smart TV market and the streaming device market are both expanding, but they are on divergent trajectories. Smart TVs are consolidating their position as the dominant gateway for home entertainment, with market valuations ranging from approximately $271 billion in 2026 to an estimated $497–$825 billion by 2033–2036 depending on the forecast source. Meanwhile, standalone streaming devices (sticks, dongles, and boxes) represent a significantly smaller but fast-growing segment valued at approximately $19–$20 billion in 2025–2026 and projected to reach $46–$61 billion by 2033–2035. The critical narrative shaping this period is smart TVs cannibalizing standalone streaming device demand in mature markets, while streaming devices retain strong relevance in emerging economies where consumers upgrade older TV sets without replacing them.
Smart TV Market Size & Growth (2026–2033)
The smart TV market is one of the largest segments within consumer electronics. Multiple research firms provide differing but directionally consistent forecasts for 2026 through 2033.
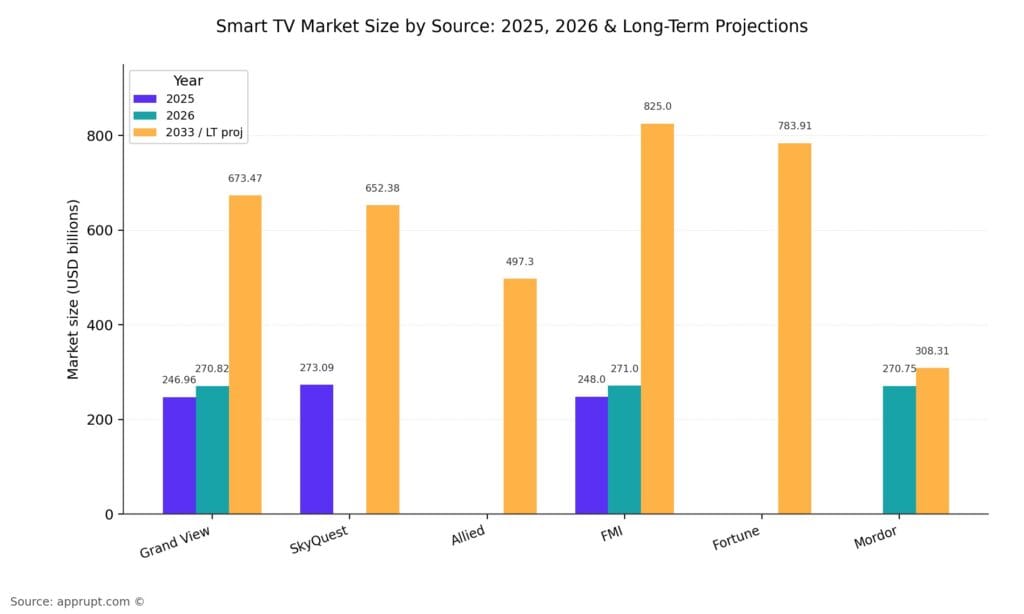
| Source | 2025 Value | 2026 Value | 2033 Projected Value | CAGR |
| Grand View Research | $246.96B | $270.82B | $673.47B | 13.9% (2026–2033) |
| SkyQuest | $273.09B | — | $652.38B | 11.5% (2026–2033) |
| Allied Market Research | — | — | $497.3B | 9.5% (2024–2033) |
| Future Market Insights | $248.0B | $271.0B | — ($825B by 2036) | 11.8% (2026–2036) |
| Fortune Business Insights | — | — | — ($783.91B by 2034) | 12.98% (2026–2034) |
| Mordor Intelligence | — | $270.75B | — ($308.31B by 2031) | 2.63% (2026–2031) |
The wide spread in estimates (from $308B to $825B at the high end) reflects different methodologies—some include only smart TV hardware, while others incorporate software platforms, OS licensing, and advertising revenue. The consensus points to a market exceeding $500 billion by the early 2030s, driven by rising internet penetration, OTT platform proliferation, and premium display technology adoption.
Streaming Device Market Size & Growth (2026–2033)
Standalone streaming devices—including media streamers (Roku, Fire TV Stick, Chromecast, Apple TV), set-top boxes, and gaming consoles used for streaming—represent a smaller but rapidly expanding market.
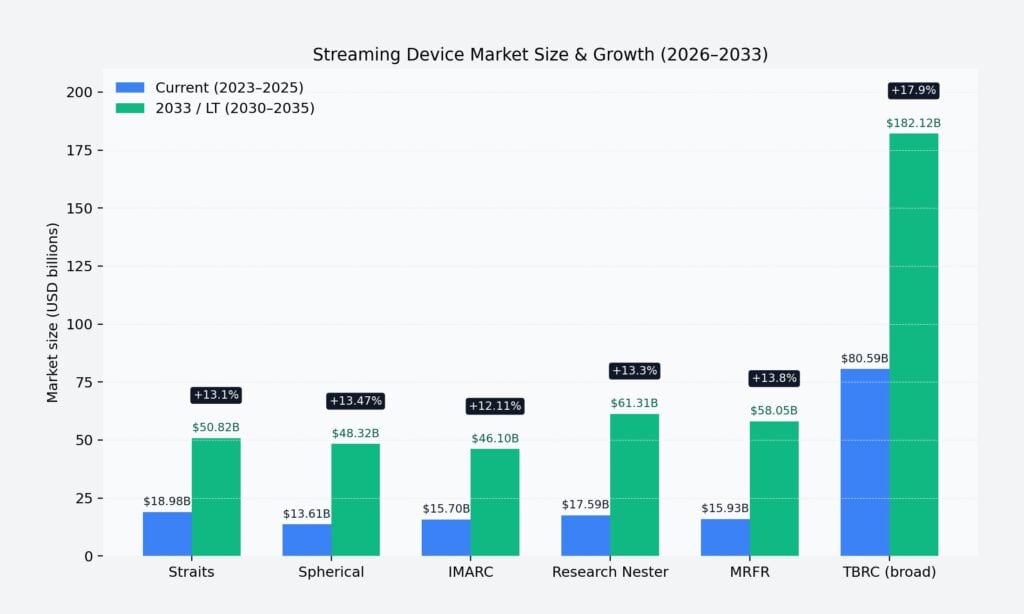
| Source | 2024–2025 Value | 2033 Projected Value | CAGR |
| Straits Research | $18.98B (2025) | $50.82B | 13.1% (2025–2033) |
| Spherical Insights | $13.61B (2023) | $48.32B | 13.47% (2023–2033) |
| IMARC Group | $15.7B (2024) | $46.1B | 12.11% (2025–2033) |
| Research Nester | $17.59B (2025) | — ($61.31B by 2035) | 13.3% (2026–2035) |
| MRFR | $15.93B (2025) | — ($58.05B by 2035) | 13.8% (2025–2035) |
| TBRC (broader definition) | $80.59B (2025) | — ($182.12B by 2030) | 17.9% (2025–2030) |
Excluding outliers that use broader market definitions (such as TBRC, which appears to include smart TV platforms within streaming media devices), most estimates converge around $46–$51 billion by 2033 with CAGRs of 12–14%. Growth is underpinned by cord-cutting momentum, expanding OTT platforms, 4K/8K content availability, and affordable device pricing.
Market Size Comparison: Smart TV vs Streaming Device
The smart TV market is roughly 13–15x larger than the standalone streaming device market in 2026. This gap is expected to widen in absolute terms through 2033.
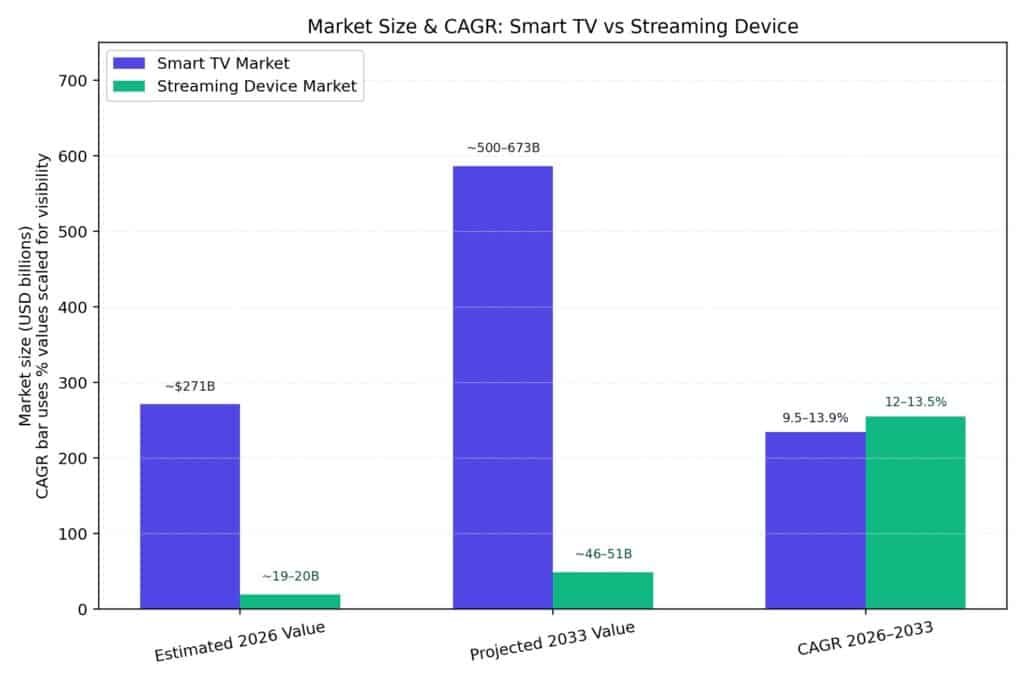
| Metric | Smart TV Market | Streaming Device Market |
| Estimated 2026 Value | ~$271 billion | ~$19–20 billion |
| Projected 2033 Value | ~$500–$673 billion | ~$46–$51 billion |
| CAGR (2026–2033) | 9.5–13.9% | 12–13.5% |
| Primary Growth Driver | OS monetization, premium displays, CTV advertising | Cord-cutting, emerging market adoption, OTT expansion |
While streaming devices are growing slightly faster in CAGR terms, their absolute market size remains a fraction of the smart TV market. The convergence of streaming capabilities into smart TVs is the primary force compressing standalone device demand in developed markets.
Smart TV Household Penetration
Smart TV adoption has crossed the majority threshold globally and continues to accelerate.
- Global penetration is projected to reach 51% of all households worldwide (approximately 1.1 billion homes) by 2026, up from 34% in 2020.
- United States: 82% of households have an internet-connected TV device, and 61% of US internet households now use a smart TV as their primary streaming device.
- Europe: Over 67% of UK households, 80%+ in Italy, and ~55% in France owned smart TVs as of 2022, with penetration continuing to rise.
- Asia Pacific: Household penetration nears 98% in China’s urban areas, while India shipped approximately 18 million units in 2025.
Smart TV penetration surpassing 54% globally means that over 1.1 billion households now have smart TVs, making them the most common connected entertainment device in the home.
TV Shipments & Unit Sales
Global TV shipments have remained broadly stable despite regional variations.
- Q4 2025: Global TV shipments were flat year-on-year at 61.5 million units.
- China experienced a 25.3% YoY decline due to the end of government subsidies, while North America grew 4.7% and Western Europe rose 3.2%.
- Emerging markets delivered the strongest growth: Latin America & Caribbean up 12.5%, Middle East & Africa up 9.4%.
- Smart TV shipments in Q2 2024 reached approximately 44 million units, growing 7.4% YoY, driven by major sporting events.
- 4K UHD TVs accounted for 45% of 2025 shipments and over 60% of shipments in 2026, with 8K gaining traction in premium segments.
- TCL and Hisense increased their combined global shipments by 2.2% YoY despite China’s decline, with their North American share rising from 28.6% to 30.7%.
Streaming Device Hardware: Declining Purchase Intent
In contrast to the smart TV market’s stability, standalone streaming device hardware is showing clear signs of maturation in developed markets.
- US streaming device sales declined 14% YoY in Q1 2024, with overall revenue in the segment dropping by 11%.
- Only 3% of US broadband households planned to purchase a new streaming media player in 2024—the lowest intent rate since 2015.
- A 2025 survey of over 1,900 Americans found 78.7% had no plans to buy a new streaming player or smart TV, up from 77.1% the previous year.
- Global media streamer shipments declined 4.8% in 2025 to approximately 59 million units, according to Futuresource Consulting.
- The number of external streaming devices connected to smart TVs in the US declined by 31% in 2024, with Roku’s connected devices dropping from 40.3 million in 2023 to 28.1 million in 2024.
This decline reflects smart TVs absorbing functionality previously requiring a separate device, combined with lengthening replacement cycles and consumer satisfaction with existing hardware.
Smart TV as Primary Streaming Device
The competitive dynamic between smart TVs and streaming devices is shifting decisively toward smart TVs as the central hub for content consumption.
- 61% of US internet households now use a smart TV as their primary streaming device, continuing the shift away from streaming sticks, boxes, and gaming consoles.
- Smart TVs are present in 68% of US internet households, compared to 43% for streaming media players.
- 56% of consumers named smart TVs as their primary viewing device, while only 34% chose streaming media players.
- Time spent streaming increased by 5% YoY in Q4 2024, while traditional linear TV viewing declined by 19%.
- Among 18–64-year-old internet users, smart TVs are now the predominant device for consuming content, with viewing time on smart TVs increasing by 27% since Q1 2021.
Streaming device brands—Roku, Amazon, and Google—have responded by pivoting to smart TV platform licensing (embedding their OS into TV sets directly), reducing their dependence on standalone hardware.
Streaming Device Market Share by Brand (US)
Despite the overall market slowdown, Roku maintains a dominant position among streaming device users.
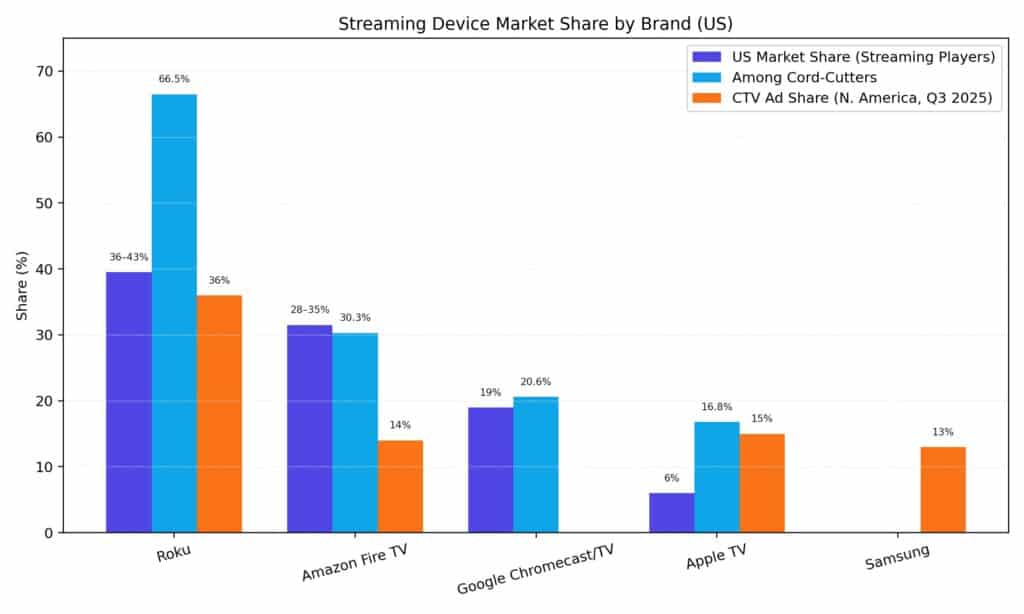
| Brand | US Market Share (Streaming Players) | Among Cord-Cutters | CTV Ad Share (N. America, Q3 2025) |
| Roku | 36–43% | 66.5% | 36% |
| Amazon Fire TV | 28–35% | 30.3% | 14% |
| Google Chromecast/TV | 19% | 20.6% | — |
| Apple TV | 6% | 16.8% | 15% |
| Samsung | — | — | 13% |
Roku’s programmatic CTV device share in North America has declined by 15 percentage points over two years (from 51% in Q3 2023 to 36% in Q3 2025), while Apple TV’s share has more than doubled from 7% to 15% in the same period. Amazon’s Fire TV has sold over 250 million devices globally as of late 2024. Roku surpassed 80 million active accounts with over 100 billion streaming hours in 2023.
Smart TV Operating System Market Share
The operating system layer has become the primary battleground for controlling the smart TV experience and monetizing audiences.
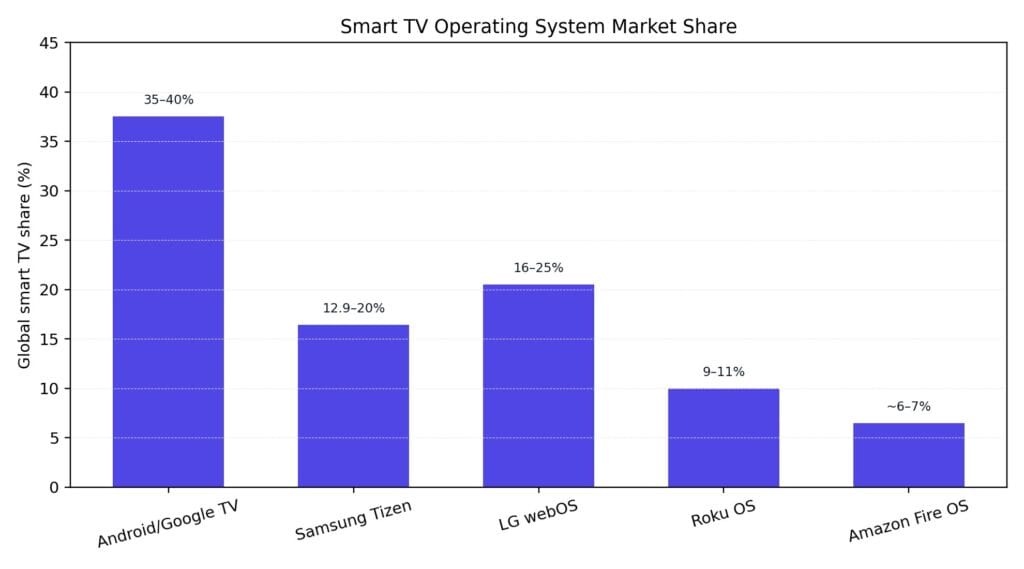
| Operating System | Global Smart TV Share | Key Highlights |
| Android/Google TV | 35–40% of shipments | Largest by shipment volume; adopted across multiple TV brands |
| Samsung Tizen | 12.9–20% globally; 34% most-used in US | Powers 120M+ smart TVs worldwide; dominant in premium segment |
| LG webOS | 16–25% | Second largest proprietary OS; Tizen + webOS = 60%+ of smart TVs sold |
| Roku OS | 9–11% globally; grew from 8% to 18% in US smart TVs (2020–2025) | Transitioning from streaming device to smart TV platform |
| Amazon Fire OS | ~6–7% | Expanding into smart TV manufacturing |
The OS war is central to the future of both markets: as streaming device makers embed their platforms into TVs, the distinction between “smart TV” and “streaming device” continues to blur.
Connected TV (CTV) Advertising Market
CTV advertising represents one of the most valuable revenue streams fueling both smart TV and streaming device ecosystems.
- US CTV ad spend reached $33.35 billion in 2025 and is projected to grow to approximately $38 billion in 2026 (14% YoY growth).
- By 2028, CTV ad spending is expected to reach $46.89 billion, surpassing traditional TV advertising for the first time.
- By 2029, the US CTV market is projected to reach approximately $51 billion.
- Linear TV has fallen to just 12% of global ad spending, while CTV is on pace to exceed 40% by 2030.
- In the US, 72.4% of TV viewing time is now ad-supported, with streaming representing 42.4% of that viewing.
- Global CTV ad revenue hit $38.3 billion in 2024, up 20% from 2023.
Smart TV manufacturers like Samsung, LG, and Vizio are increasingly monetizing their platforms through advertising, FAST channels, and data-driven ad targeting using automatic content recognition (ACR) technology.
FAST (Free Ad-Supported Streaming TV) Market
FAST services are accelerating the convergence of smart TVs and streaming, providing a free linear TV experience delivered through smart TV platforms.
- The global FAST market was valued at approximately $12.26 billion in 2025 and is estimated at $14.33 billion in 2026.
- 64% of US Roku households now stream FAST content across various ad-supported channels.
- FAST viewing on the Roku Channel has grown 262x faster than the overall TV streaming market since 2020.
- 57% of households that were streaming only ad-free in 2020 now watch FAST content.
- Linear FAST channels held 67.2% of viewing in 2025, with on-demand libraries expanding at a 22.97% CAGR.
- The AVOD market (broader category including FAST) was valued at $54.14 billion in 2025 and is projected to reach $218.31 billion by 2033, growing at a CAGR of 19.12%.
FAST represents a critical revenue engine for both smart TV platforms and streaming device makers, as it transforms smart TVs into ad-monetizable, always-on entertainment hubs.
Regional Dynamics
Asia Pacific
Asia Pacific is the largest regional market for smart TVs, accounting for approximately 33–47% of global revenue in 2025. China leads with approximately 52 million unit shipments in 2025, though its household penetration is near saturation at 98%. India shipped approximately 18 million units and benefits from localization incentives and a rising middle class. The region is also the fastest-growing market for streaming devices, driven by affordable hardware and expanding broadband.
North America
North America holds approximately 32% of the global smart TV market and remains the leading destination for TV shipments, with over 15 million units shipped in Q4 2025 alone. The US is the dominant market for CTV advertising, with the world’s most mature streaming ecosystem. However, streaming device purchase intent is at historic lows, as smart TVs absorb standalone device demand.
Europe
Europe accounts for about 25% of the global smart TV market. Western Europe is now the second-largest regional TV market by shipments, with OLED TVs seeing 11.5% growth in the region. Smart TV penetration is high, particularly in Italy (80%+) and the UK (67%+).
Emerging Markets
Latin America & Caribbean and Middle East & Africa showed the strongest growth in TV shipments (12.5% and 9.4% YoY, respectively, in Q4 2025). In these regions, standalone streaming devices—especially low-cost Android TV boxes—remain essential for bringing smart capabilities to legacy TV sets.
Key Trends Shaping 2026–2033
Smart TVs Becoming OS-Led Platforms
Smart TV manufacturers are shifting from hardware margin to software and advertising monetization. FMI notes the market’s expected $577 billion absolute growth over the coming decade signals “structural transformation rather than cyclical replacement,” as smart TVs evolve into operating-system-led entertainment hubs.
Streaming Device Makers Pivoting to Software
Roku, Amazon, and Google have all embedded their OS into smart TVs from third-party manufacturers, reducing reliance on standalone hardware. Roku’s smart TV OS share grew from 8% in 2020 to 18% in 2025. Futuresource notes that “traditional streamer brands are repositioning around platform licensing and software innovation, reducing reliance on hardware volumes”.
AI Integration
Both smart TVs and streaming devices are integrating AI for content recommendations, voice control, and smart home orchestration. Google’s 2024 Google TV Streamer doubled as a smart home hub with AI-powered content discovery. AI-driven personalization is becoming the key competitive differentiator across all platforms.
Cord-Cutting Momentum
Cord-cutting continues to accelerate, with cable TV adoption projected to fall below 60% by 2030. Approximately 86.7% of cord-cutters cite cost as their primary reason for switching. Streaming now accounts for 43.5% of US TV viewing as of early 2025.
Premium Display Technology
OLED shipments grew 8.6% YoY in Q4 2025, while Mini LED is positioning as a core premium offering from Chinese manufacturers TCL and Hisense. The push toward 65-inch+ screens and 8K content drives premium smart TV replacement cycles.
Conclusion
The 2026–2033 period will be defined by the continued ascent of smart TVs as the central platform for home entertainment, with standalone streaming devices shifting from primary hardware to complementary and emerging-market solutions. Smart TVs are projected to grow from approximately $271 billion in 2026 to $500–$673 billion by 2033, while streaming devices are expected to expand from roughly $19–20 billion to $46–51 billion over the same period. The convergence of streaming functionality into smart TV operating systems, the maturation of CTV advertising (projected to surpass $50 billion by 2029), and the explosive growth of FAST channels are reshaping competition at the OS and platform layer rather than the hardware layer. Streaming device makers who successfully transition to platform licensing and ad monetization—rather than relying on hardware sales—will remain competitive in this evolving landscape.