The cord-cutting revolution has reached an inflection point. By the end of 2026, an estimated 80.7 million U.S. households will have abandoned traditional pay TV, leaving only 54.3 million homes with cable or satellite subscriptions. Streaming now commands 47.5% of all U.S. TV viewing time — a record high — while cable has plummeted to 20.2%, its lowest share ever. In 2025, streaming surpassed the combined viewing share of broadcast and cable television for the first time in history. Globally, streaming revenue ($213 billion) overtook pay TV revenue ($188 billion) for the first time in 2025. With projections showing 76% of U.S. homes will be cord-free by 2027, the traditional TV industry is entering a period of accelerated structural decline.
U.S. Cord-Cutting Households
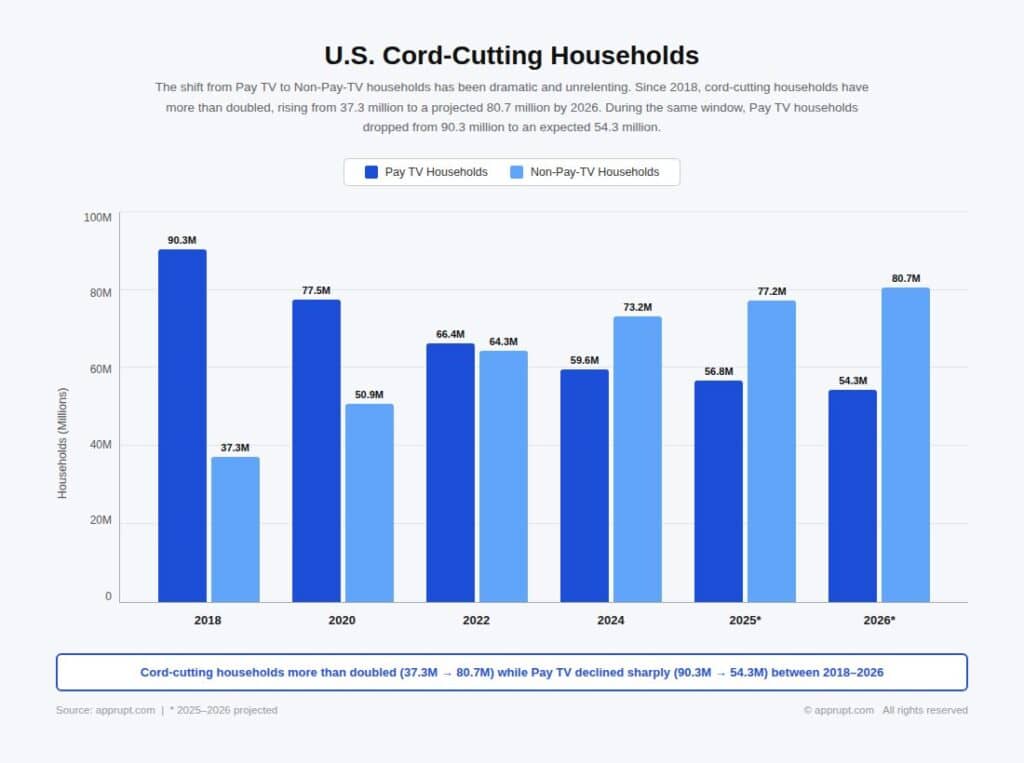
The shift from pay TV to non-pay-TV households has been dramatic and unrelenting. Since 2018, cord-cutting households have more than doubled, rising from 37.3 million to a projected 80.7 million by 2026. During the same window, pay TV households dropped from 90.3 million to an expected 54.3 million.
| Year | Pay TV Households | Non-Pay-TV Households |
| 2018 | 90.3 million | 37.3 million |
| 2020 | 77.5 million | 50.9 million |
| 2022 | 66.4 million | 64.3 million |
| 2024 | 59.6 million | 73.2 million |
| 2025* | 56.8 million | 77.2 million |
| 2026* | 54.3 million | 80.7 million |
Source: eMarketer estimates
By end of 2026, an estimated 75% of U.S. TV households will no longer have a traditional TV subscription — up from just 20% in 2015. Pay TV penetration dropped from a peak of 88% in 2010 to 34.4% by the end of 2024, according to S&P Global Market Intelligence. It is projected to fall to approximately 42.4% in 2026.
Cable TV Subscriber Decline
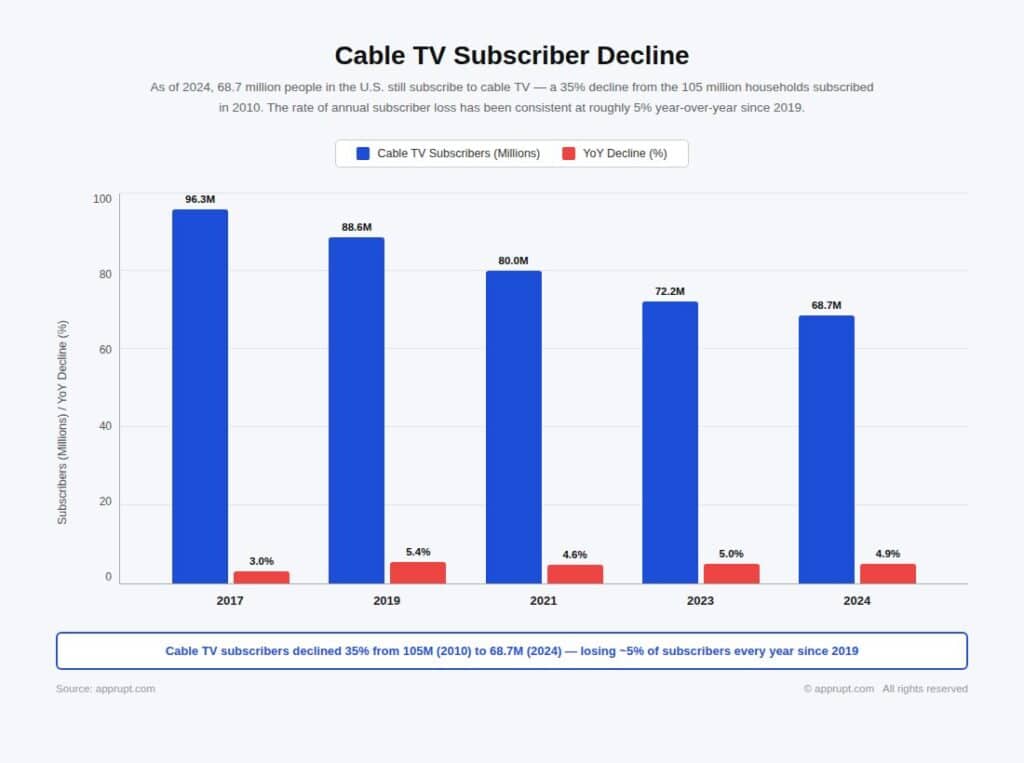
As of 2024, 68.7 million people in the U.S. still subscribe to cable TV — a 35% decline from the 105 million households subscribed in 2010. The rate of annual subscriber loss has been consistent at roughly 5% year-over-year since 2019.
| Year | Cable TV Subscribers | YoY Decline |
| 2017 | 96.3 million | 3.0% |
| 2019 | 88.6 million | 5.4% |
| 2021 | 80 million | 4.6% |
| 2023 | 72.2 million | 5.0% |
| 2024 | 68.7 million | 4.9% |
Source: IBIS World via Evoca
S&P Global projects the average cable network will see a 5.4% annual decline in subscribers from 2025 through 2029, with widely distributed networks like C-SPAN and Food Network expected to lose 15 to 20 million subscribers by 2029.
Major Operator Losses in 2025
The two largest cable operators both reported significant subscriber erosion in 2025:
- Comcast lost 1.25 million video subscribers in 2025, ending the year with approximately 11.3 million — down from 12.5 million at the end of 2024 and 14.1 million in 2023.
- Charter (Spectrum) lost 255,000 pay TV subscribers for the full year 2025, a marked improvement from 1.2 million lost in 2024. Charter’s Q4 2025 saw a surprise addition of 49,000 video subscribers — its first positive quarter since 2020 — driven by SVOD bundling strategies.
A brief quarterly uptick in Q3 2025, when pay TV operators collectively added 303,000 net subscribers (the first quarterly gain since 2017), was largely driven by virtual pay TV services like YouTube TV rather than actual cable gains. Year-over-year, subscribers were still down 5.8%.
Streaming Dominance: Viewing Share
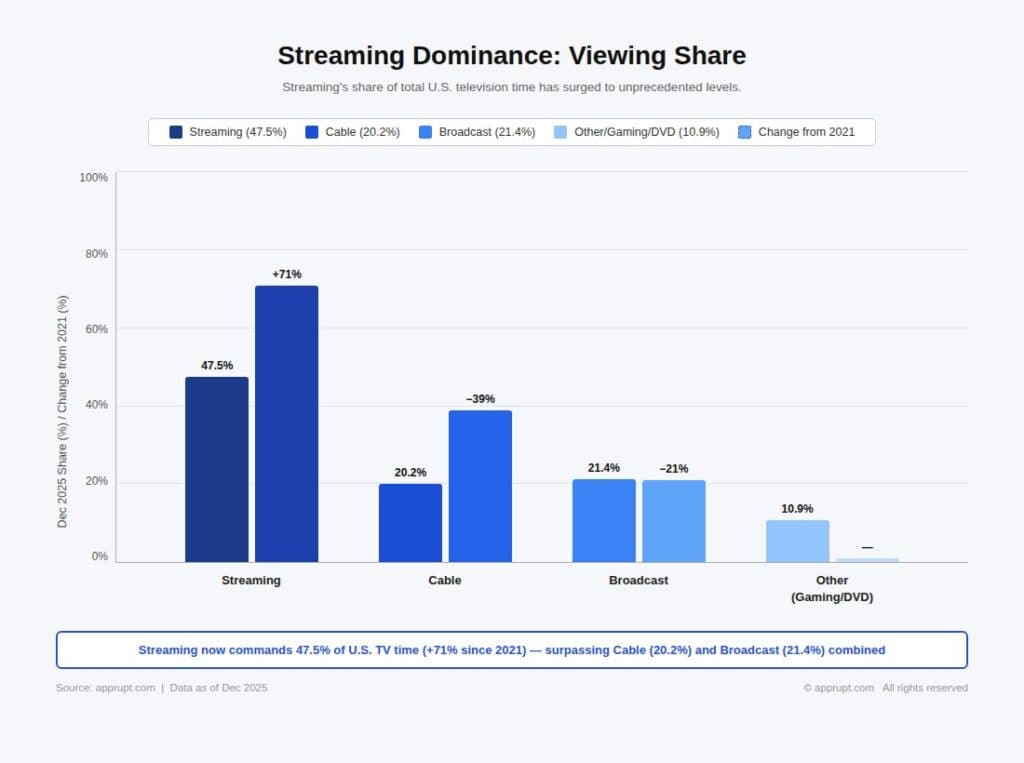
Streaming’s share of total U.S. television time has surged to unprecedented levels.
| Viewing Category | Dec 2025 Share | Change from 2021 |
| Streaming | 47.5% | +71% |
| Cable | 20.2% | −39% |
| Broadcast | 21.4% | −21% |
| Other (Gaming/DVD) | 10.9% | — |
Source: Nielsen’s The Gauge
In May 2025, streaming captured 44.8% of total TV usage, surpassing the combined share of broadcast (20.1%) and cable (24.1%) for the first time in television history. By December 2025, streaming reached a monthly average of 47.5%. On Christmas Day 2025, streaming captured a staggering 54% of daily TV viewing with 55.1 billion viewing minutes.
YouTube leads among individual platforms with 12.7% of total TV viewing in December 2025, followed by Netflix at 9.0%. Free ad-supported streaming TV (FAST) channels — including Pluto TV, Roku Channel, and Tubi — collectively accounted for 5.7% of total viewing in May 2025, more than any single broadcast network.
Revenue Impact
Cord-cutting has inflicted massive revenue damage on the traditional TV industry. Pay TV revenue has declined from $100.09 billion in 2017 to an estimated $84.29 billion in 2024, a 16.5% drop. By 2027, revenue is projected to fall further to $81.33 billion. The U.S. cable industry is expected to see a cumulative $30 billion decline in traditional pay-TV subscription and advertising revenue compared to 2017 levels.
Streaming Revenue Surpasses Pay TV
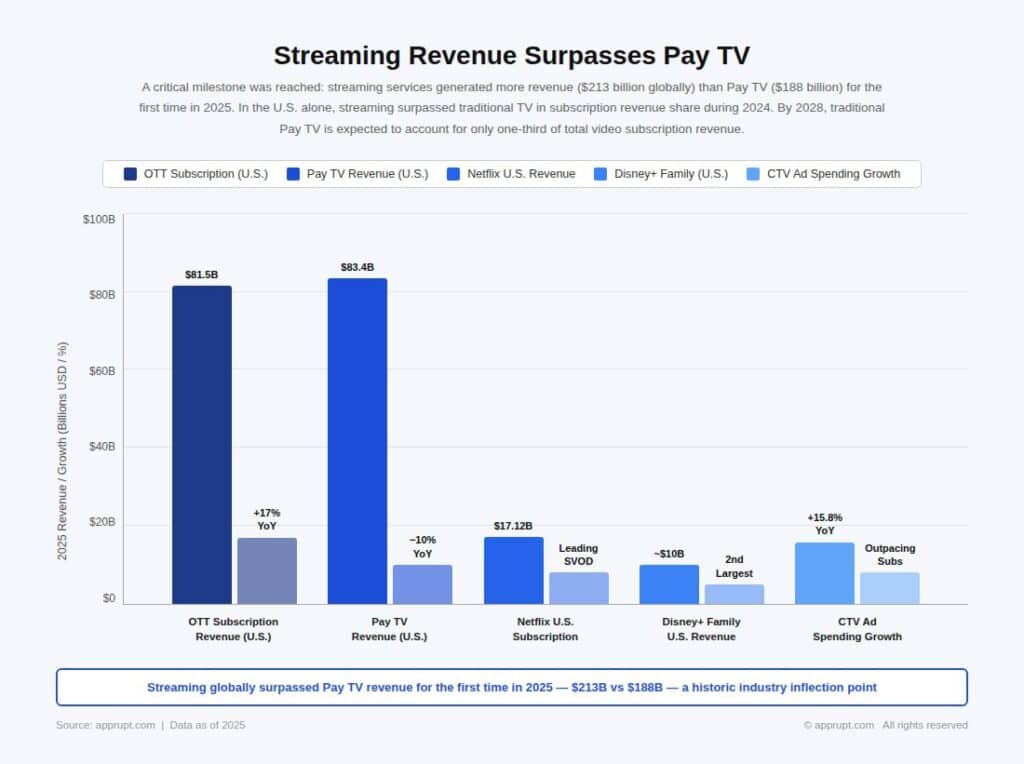
A critical milestone was reached: streaming services generated more revenue ($213 billion globally) than pay TV ($188 billion) for the first time in 2025. In the U.S. alone, streaming surpassed traditional TV in subscription revenue share during 2024. By 2028, traditional pay TV is expected to account for only one-third of total video subscription revenue.
| Revenue Segment | 2025 | Trajectory |
| OTT subscription revenue (U.S.) | $81.5 billion | +17% YoY |
| Pay TV revenue (U.S.) | ~$83.4 billion | −10% YoY |
| Netflix U.S. subscription revenue | $17.12 billion | Leading SVOD |
| Disney+ family U.S. revenue | ~$10 billion | Second largest |
| CTV ad spending growth (U.S.) | +15.8% YoY | Outpacing subscription growth |
The Convergence Research “Battle for the American Couch Potato” report found that OTT subscription revenue grew 18% in 2024, reaching $69.5 billion. A comparable 17% growth was projected for 2025, bringing total OTT revenue to $81.5 billion and surpassing cable TV subscription revenue for the first time.
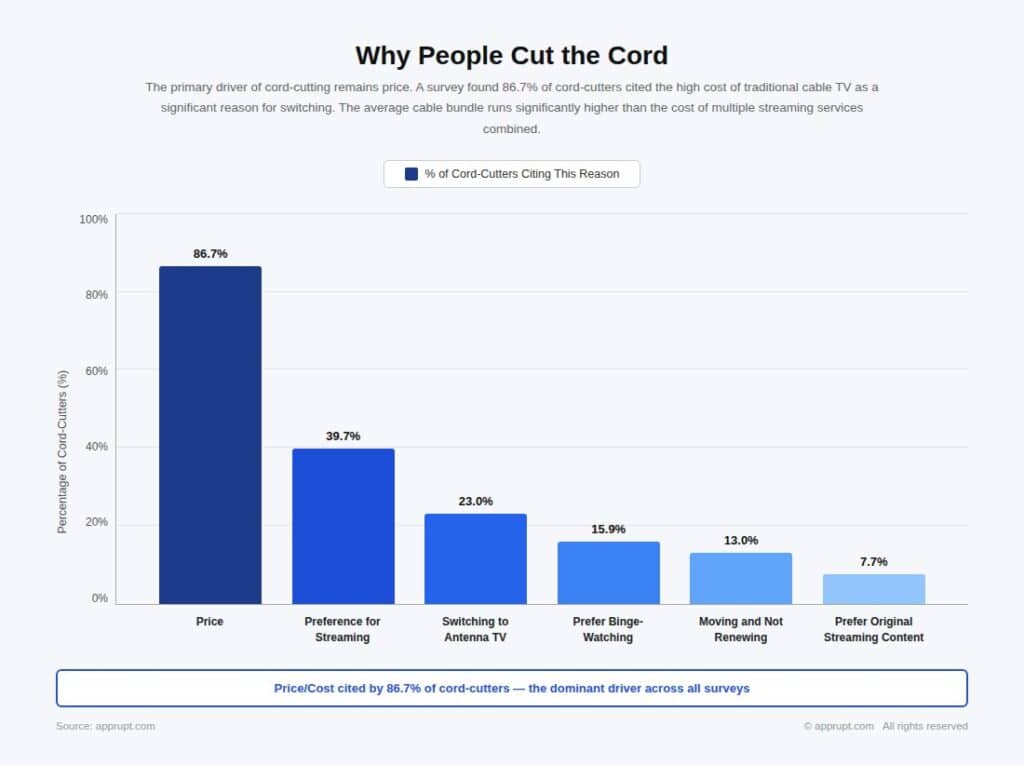
Why People Cut the Cord
The primary driver of cord-cutting remains price. A survey found 86.7% of cord-cutters cited the high cost of traditional cable TV as a significant reason for switching. The average cable bundle runs significantly higher than the cost of multiple streaming services combined.
| Reason | % of Cord-Cutters |
| Price | 86.7% |
| Preference for streaming | 39.7% |
| Switching to antenna TV | 23.0% |
| Prefer binge-watching | 15.9% |
| Moving and not renewing | 13.0% |
| Prefer original streaming content | 7.7% |
Source: Broadband Search via Evoca
Notably, streaming costs are also rising. U.S. viewers now pay an average of $69 per month for four streaming services, up 13% from the prior year, according to Deloitte. The average OTT platform price increased 14% in 2024. However, the flexibility of ad-supported tiers (which cost 42% less than ad-free plans) and the ability to cancel anytime continue to make streaming more appealing than long-term cable contracts.
Demographics: Cord-Nevers and Young Adults
Younger Americans are not just cutting the cord — they never had one. Approximately 50% of consumers under age 32 have never paid for cable TV, forming a “cord-never” generation that represents a permanent loss for the pay TV industry.
Among 18–29-year-olds, cable TV ownership fell from 65% in 2015 to just 34% in 2021 — the steepest decline across any age demographic. For the 30–49 age group, the share dropped from 73% to 46% over the same period. The average cord-cutter is currently between 35 and 55 years old, indicating the trend has firmly moved beyond younger demographics into middle-aged households.
Among those most likely to cancel cable within the next 12 months, the 35–54 age group shows the highest intent, with 16% saying they are “extremely likely” to cancel — compared to just 4% of those over 55.
Rise of Virtual MVPDs
While traditional cable declines, virtual multichannel video programming distributors (vMVPDs) like YouTube TV are rapidly growing, effectively replacing cable as the live TV distribution model.
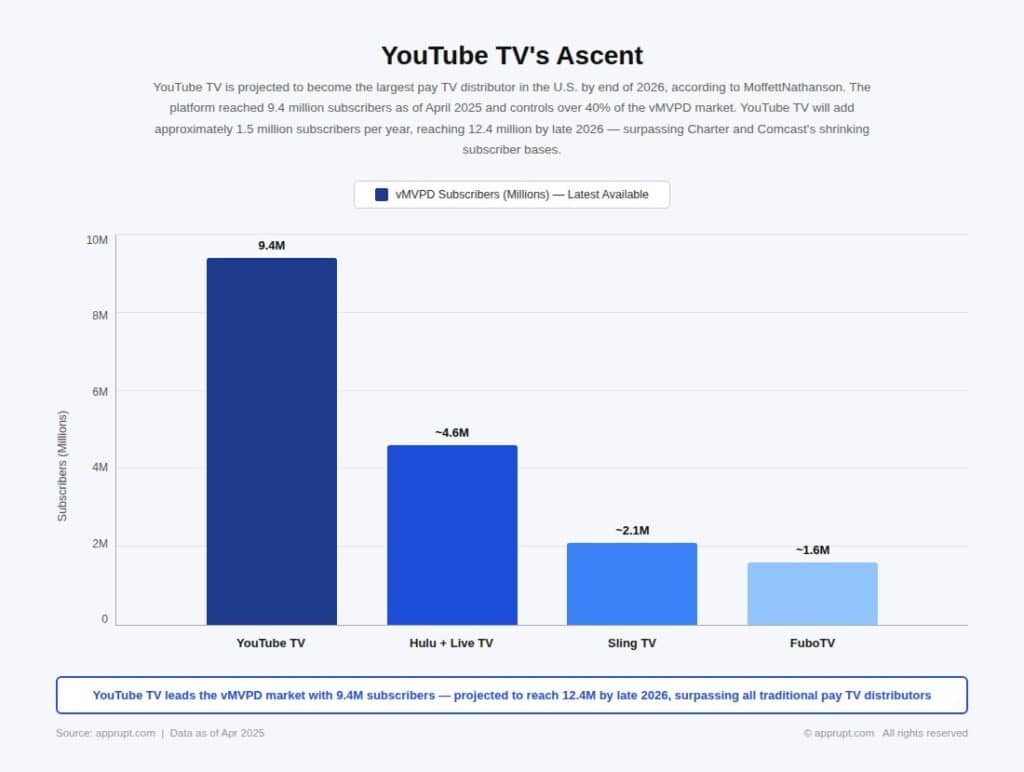
YouTube TV’s Ascent
YouTube TV is projected to become the largest pay TV distributor in the U.S. by end of 2026, according to MoffettNathanson. The platform reached 9.4 million subscribers as of April 2025 and controls over 40% of the vMVPD market. MoffettNathanson forecasts YouTube TV will add approximately 1.5 million subscribers per year, reaching 12.4 million by late 2026 — surpassing Charter and Comcast’s shrinking subscriber bases.
| vMVPD Service | Subscribers (Latest) |
| YouTube TV | 9.4 million (Apr 2025) |
| Hulu + Live TV | ~4.6 million |
| Sling TV | ~2.1 million |
| FuboTV | ~1.6 million |
However, rising vMVPD costs are a concern. YouTube TV’s monthly price has surged from $35 at its 2017 launch to $73 in 2025. MoffettNathanson estimates YouTube TV generated around $6 billion in annual revenue, up from $900 million in 2019.
FAST Channels: Free Streaming Boom
Free ad-supported streaming TV (FAST) channels are among the fastest-growing segments of the streaming ecosystem. U.S. viewers streamed 1.8 billion hours of FAST content through August 2025, a 43% increase over the same period in 2024.
The global FAST market is valued at $14.33 billion in 2026 and projected to reach $31.29 billion by 2031. Sports programming on FAST platforms is growing at a 21.95% CAGR through 2031, the highest among all content genres. In early 2025, the NFL Super Bowl was broadcast live on Tubi (a FAST platform owned by Fox), attracting 13 million viewers — a landmark event for ad-supported free streaming.
Netflix’s ad tier has reached 190 million monthly active viewers globally. The share of U.S. households watching ad-supported content on Disney+ increased by 16 percentage points year-over-year through August 2025, while Netflix’s ad-supported viewing rose 11 points.
Live Sports: The Last Cord-Cutting Battleground
Live sports remain the most significant factor keeping some households tethered to traditional TV. However, streaming platforms are aggressively acquiring sports rights, weakening cable’s final stronghold.
Key developments:
- Amazon Prime Video secured an 11-year NBA rights deal starting in the 2025–26 season.
- Netflix obtained exclusive U.S. rights to the FIFA Women’s World Cup in 2027 and 2031.
- Five major SVOD platforms (Amazon, Apple TV+, Disney+, Netflix, Paramount+) increased live sports programming volume by 72% since end of 2024.
- By 2027, there will be 52 million more digital sports viewers than traditional TV sports viewers in the U.S..
- Major League Baseball will stream local games for 22 teams via its MLB.tv direct-to-consumer app.
The collapse of regional sports networks (RSNs) has accelerated this shift. Teams in the NBA, NHL, and MLB are increasingly supplementing local broadcast coverage with their own streaming options. FAST sports channels — available through platforms like Tubi, Roku Channel, and Pluto TV — have seen a 65% increase in live sports content hours year-over-year.
Global Cord-Cutting Trends
Developed Markets
Cord-cutting is not limited to the U.S. Globally, Digital TV Research forecasts that while 86 countries will add pay TV subscribers between 2021 and 2027, 52 countries will lose them. Revenue will decline in 70 of 138 countries studied, with global pay TV revenues falling by $25 billion over the same period. The U.S. will be the biggest loser — down by 12 million subscribers and $19 billion in revenue. Western Europe is projected to lose around 9 million subscribers between 2023 and 2029. In Canada, 46% of households shed cable in 2024.
India
India’s cable TV industry faces a parallel crisis. Pay TV subscribers dropped from 151 million in 2018 to 111 million in 2024 and are expected to fall further to 71–81 million by 2030. An estimated 577,000 cumulative job losses occurred between 2018 and 2025 due to the contraction. Revenue declined by more than 16% since 2018, from ₹25,700 crore in FY19 to ₹21,500 crore in FY24.
The shift in India is driven by rising channel costs, competition from OTT platforms, and the growing popularity of DD Free Dish (free satellite TV). The decline is sharper in urban areas, where higher disposable income and wired broadband access drive adoption of streaming platforms. However, a strong tradition of TV viewing, affordable hybrid offerings, and patchy internet infrastructure mean the pace of cord-cutting will remain relatively moderate compared to the U.S..
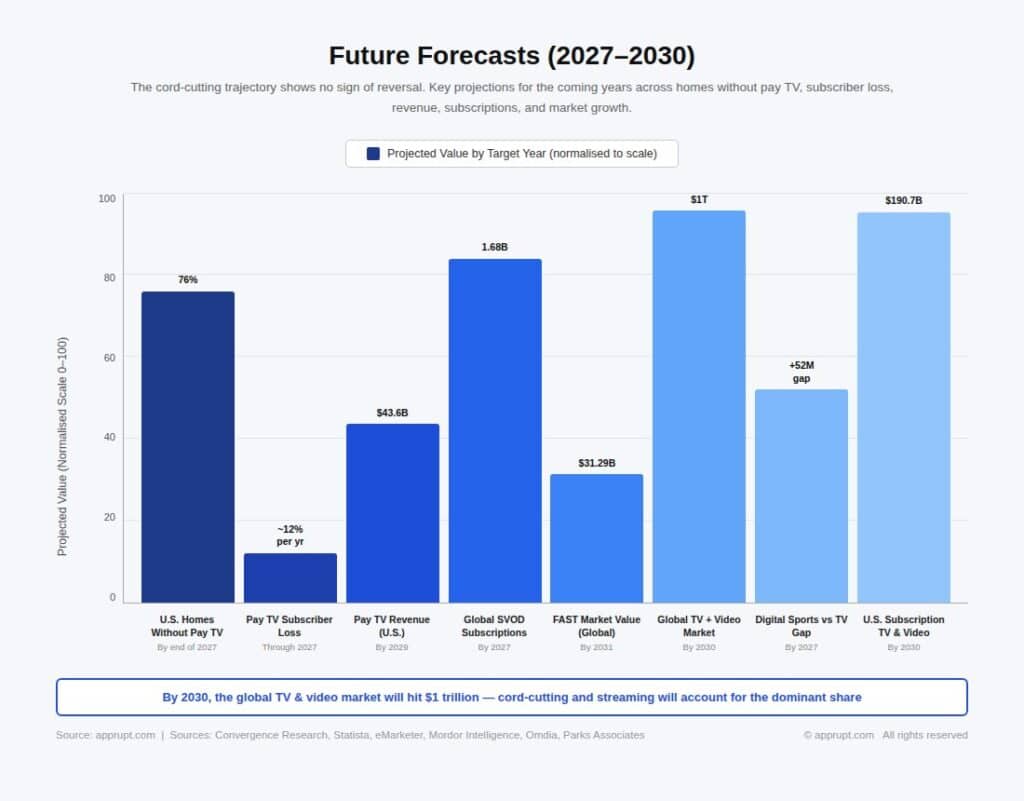
Future Forecasts (2027–2030)
The cord-cutting trajectory shows no sign of reversal. Key projections for the coming years:
| Metric | Projection | Timeline | Source |
| U.S. homes without pay TV | 76% | By end of 2027 | Convergence Research |
| U.S. pay TV annual subscriber loss | ~12% per year | Through 2027 | Convergence Research |
| Pay TV revenue (U.S.) | $43.6 billion | By 2029 | Statista |
| Global SVOD subscriptions | 1.68 billion | By 2027 | eMarketer |
| FAST market value (global) | $31.29 billion | By 2031 | Mordor Intelligence |
| Global TV + video market | $1 trillion | By 2030 | Omdia |
| Digital sports viewers exceeding TV sports viewers | +52 million gap | By 2027 | eMarketer |
| U.S. total subscription TV & video revenue | $190.7 billion | By 2030 | Parks Associates |
The average monthly household spend on subscription TV and video is projected to grow from $101.25 in 2020 to a peak of $122.74 in 2028, mainly due to rising prices across streaming services, before a slight dip to $122.04 by 2030.
Industry Response: Consolidation and Adaptation
Cable operators are responding to the existential threat through consolidation and strategic pivots. The most significant move is the Charter-Cox $34.5 billion merger, which will create the largest cable and internet provider in the U.S. with over 38 million customers, surpassing Comcast. The merger aims to cut costs, streamline operations, and invest in next-generation infrastructure.
Operators are also bundling streaming services into cable packages to slow subscriber defections. Charter’s strategy of including ad-supported versions of Disney+, Hulu, HBO Max, Peacock, and other services in Spectrum TV Select packages helped reduce its 2025 subscriber losses to 255,000 — down from 1.2 million in 2024. However, as Comcast’s continued losses demonstrate, bundling alone has not been sufficient to reverse the trend.
The broader industry is pivoting from video as a profit center to connectivity (broadband, wireless) as the core business. Comcast’s wireless division added 1.5 million net lines in 2025, reaching 9.3 million total wireless customers — a 19% increase — even as its video business contracted.
Conclusion
The cord-cutting era has evolved from a disruptive trend into a structural transformation of the television industry. With 80.7 million U.S. households expected to be cord-free by 2026 and streaming capturing nearly half of all TV viewing time, the question is no longer whether cable will decline but how quickly. The industry’s response — through mega-mergers, streaming bundles, and pivots to connectivity — may slow the bleeding but cannot reverse a consumer shift driven by economics, technology, and generational change. By 2030, the global TV and video market is projected to exceed $1 trillion in combined revenue, but virtually all growth will come from streaming, ad-supported services, and digital distribution rather than traditional pay TV.