The battle between streaming and cable TV has reached a decisive tipping point. As of December 2025, streaming captured 47.5% of all U.S. television viewing — a record high — while cable dropped to a historic low of 20.2%. By 2026, an estimated 80.7 million U.S. households will have cut the cord, outnumbering the 54.3 million households still paying for traditional TV. Netflix surpassed 325 million global subscribers, cable providers like Comcast lose approximately 3,500 TV customers every single day, and the streaming industry is projected to grow to over $112 billion in the U.S. alone by 2029. This report provides a comprehensive statistical breakdown of the streaming vs. cable landscape in 2026 and beyond.
TV Viewership Share: Streaming’s Dominance
Historic Milestone in 2025
In May 2025, streaming captured 44.8% of all TV viewing, surpassing the combined viewership of broadcast (20.1%) and cable (24.1%) for the first time in history, according to Nielsen’s monthly report, The Gauge. By December 2025, streaming’s share surged to 47.5%, while cable plummeted to a record low of 20.2% and broadcast held at 21.4%.
The dominance was especially pronounced during peak moments. On Christmas Day 2025, streaming captured 54% of all TV viewing with 55.1 billion viewing minutes — shattering the previous single-day record by 8%. December 13, 2025 also saw streaming cross the 50% daily threshold for the first time, hitting 50.4%.
Four-Year Viewing Trends
Since Nielsen began tracking with The Gauge in 2021, the shift has been dramatic:
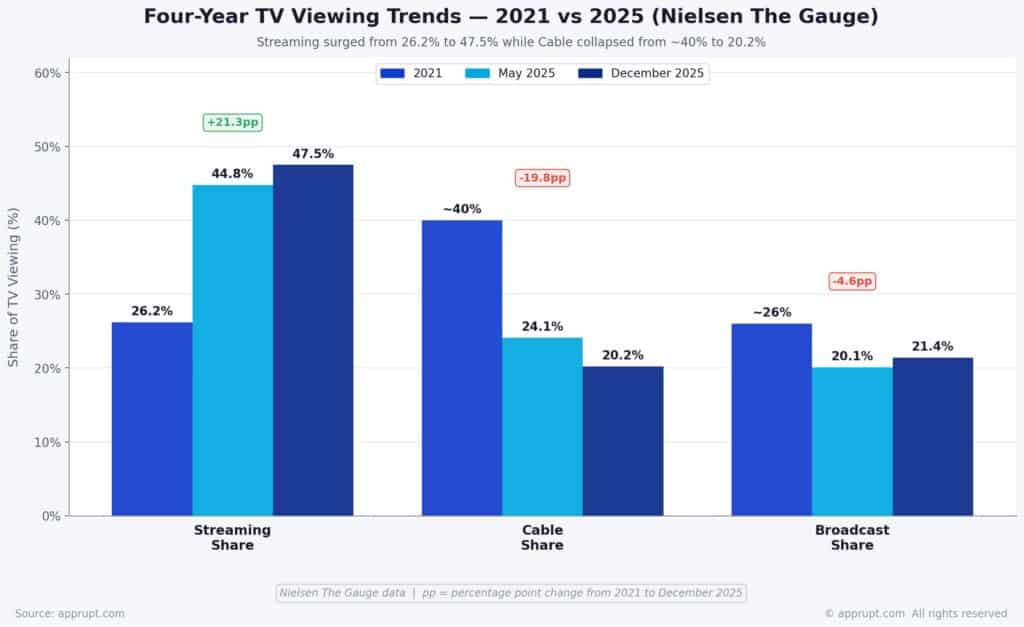
| Metric | 2021 | May 2025 | December 2025 |
| Streaming share | 26.2% | 44.8% | 47.5% |
| Cable share | ~40% | 24.1% | 20.2% |
| Broadcast share | ~26% | 20.1% | 21.4% |
Streaming usage increased 71% since 2021, while cable viewing declined 39% over the same period. Some measurement firms like Samba TV suggest the shift is even more aggressive, reporting streaming at 60% of total viewing time.
Cord-Cutting: Households and Penetration
U.S. Cord-Cutting Households
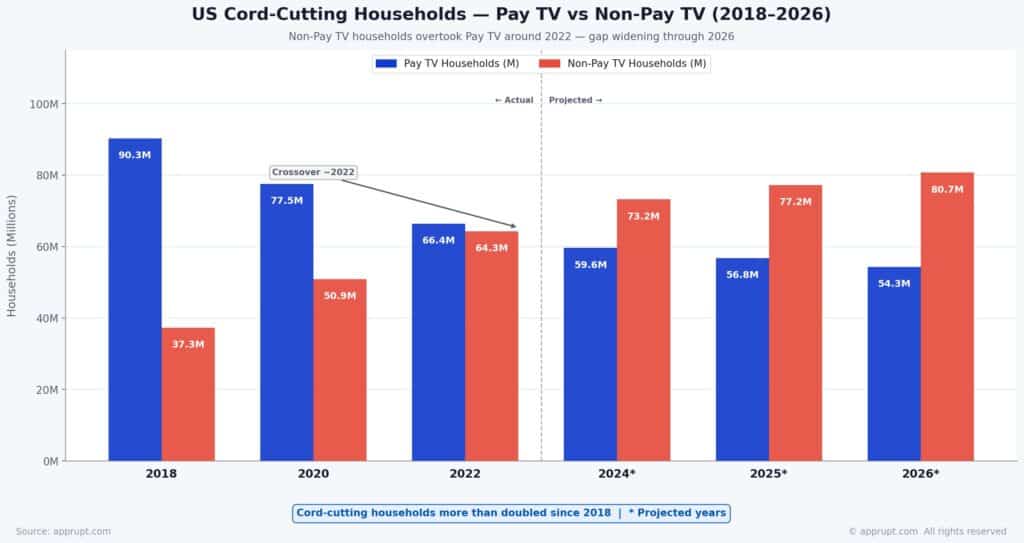
The number of cord-cutting households has more than doubled since 2018 and is projected to continue growing:
| Year | Pay TV Households | Non-Pay-TV Households |
| 2018 | 90.3 million | 37.3 million |
| 2020 | 77.5 million | 50.9 million |
| 2022 | 66.4 million | 64.3 million |
| 2024* | 59.6 million | 73.2 million |
| 2025* | 56.8 million | 77.2 million |
| 2026* | 54.3 million | 80.7 million |
Source: eMarketer estimates
Pay TV Penetration Decline
Pay TV penetration has collapsed from its 2010 peak of 88% to approximately 50% by the end of 2025. The trajectory continues downward:
- 2026 projection: 42.4% pay TV penetration
- 2028 projection: Just 32% of U.S. homes will have traditional pay TV, according to GlobalData
- 75% of U.S. TV households are expected to lack a traditional TV subscription by the end of 2026
A 2025 Deloitte survey confirms that paid subscribers have fallen to 49% of U.S. households, down from roughly 90% of TV households in 2010.
Cable Subscriber Losses: Provider-Level Data
Major Provider Declines
The two largest U.S. cable providers — Comcast and Charter (Spectrum) — continue to hemorrhage subscribers at an alarming rate:
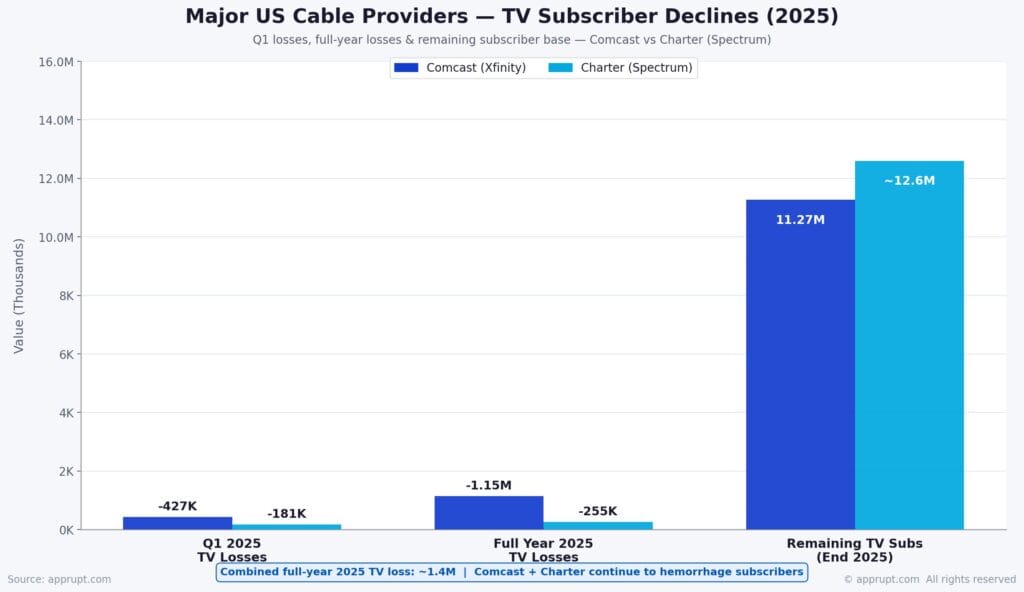
| Provider | Q1 2025 TV Losses | Full Year 2025 TV Losses | Remaining TV Subs (End 2025) |
| Comcast (Xfinity) | 427,000 | 1.15 million | 11.27 million |
| Charter (Spectrum) | 181,000 | 255,000 | ~12.6 million |
Comcast lost 245,000 pay TV customers in Q4 2025 alone, bringing its rate of loss to roughly 3,500 TV customers per day. Over the full year 2025, Comcast and Charter collectively lost over 1.3 million pay-TV customers in the first three quarters, with additional losses in Q4.
Cable TV Subscriber Trendline
Cable TV subscribers in the U.S. have declined steadily from their peak:
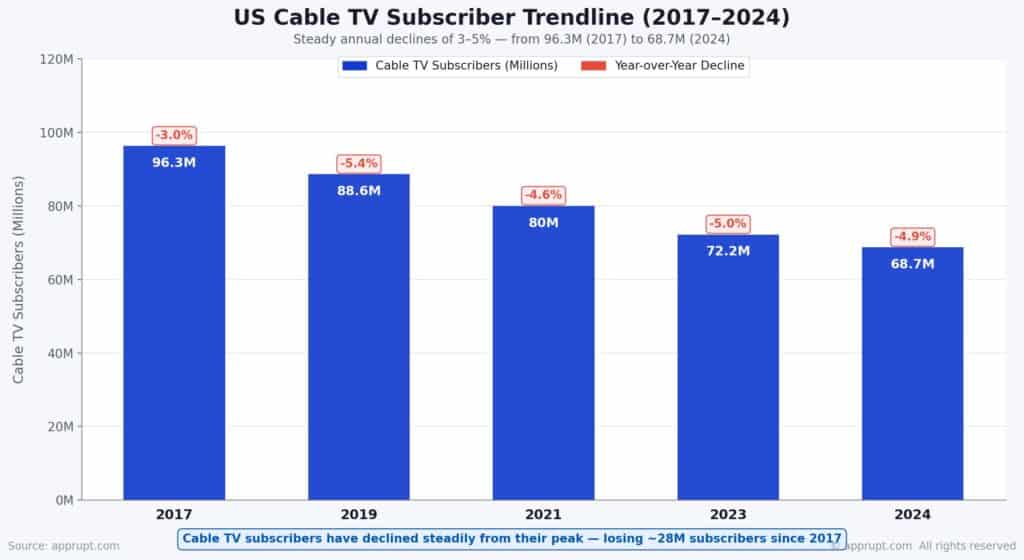
| Year | Cable TV Subscribers | Year-over-Year Decline |
| 2017 | 96.3 million | 3.0% |
| 2019 | 88.6 million | 5.4% |
| 2021 | 80 million | 4.6% |
| 2023 | 72.2 million | 5.0% |
| 2024 | 68.7 million | 4.9% |
In just 15 years, pay TV has lost over a third of its customer base, dropping from 105 million households in 2010 to 68.7 million in 2024.
A Brief Q3 2025 Uptick — and Why It Didn’t Last
For the first time in eight years, pay TV providers saw a net subscriber increase in Q3 2025, adding over 303,000 subscribers. This was primarily driven by the NFL regular season and strong vMVPD growth (YouTube TV added ~750,000 subscribers). Analysts cautioned the rebound was seasonal and temporary, and Q4 2025 data confirmed a return to net losses.
Streaming Subscriber and Revenue Growth
Major Platform Subscribers
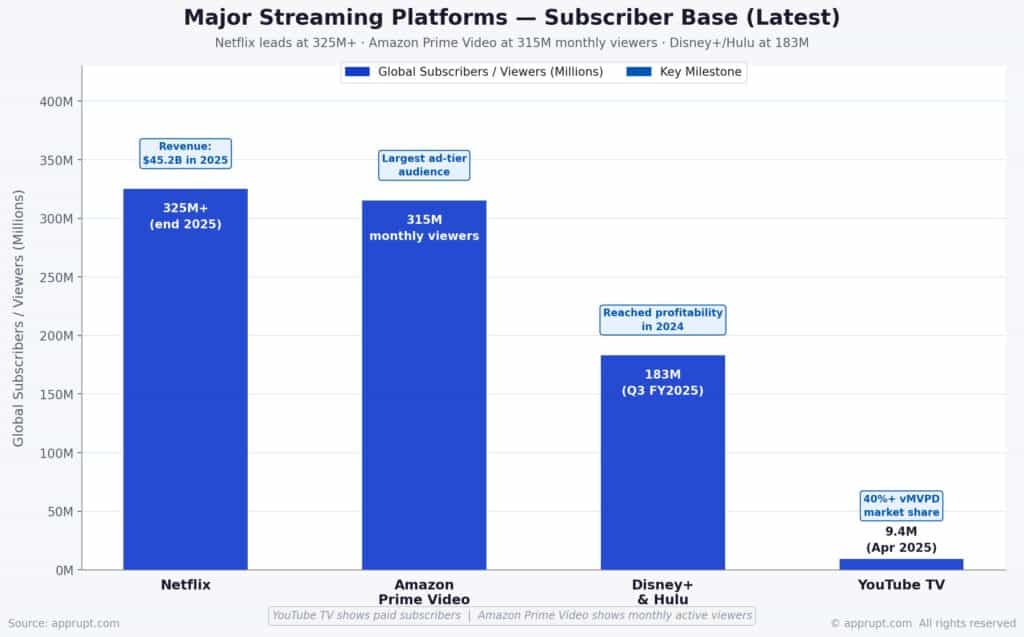
| Platform | Global Subscribers (Latest) | Key Milestone |
| Netflix | 325+ million (end 2025) | Revenue: $45.2B in 2025 |
| Amazon Prime Video | 315 million monthly viewers | Largest ad-tier audience |
| Disney+ & Hulu | 183 million (Q3 FY2025) | Reached profitability in 2024 |
| YouTube TV | 9.4 million (April 2025) | 40%+ vMVPD market share |
Netflix remains the global leader, with its subscriber base growing 8.6% year-over-year from 301.6 million to 327.7 million by Q4 2025. The company plans to invest $20 billion in content for 2026. YouTube TV is forecasted to become the largest pay-TV distributor in the U.S. by end of 2026, potentially reaching 12.4 million subscribers.
Streaming Market Revenue
The U.S. streaming market continues robust growth, with several forecasts pointing toward massive expansion:
- U.S. OTT market: Expected to grow at 5.9% CAGR, reaching over $112 billion by 2029, up from $84.7 billion in 2024
- Global video streaming: Valued at $212.83 billion in 2026, projected to reach $356.2 billion by 2031 at 10.85% CAGR
- U.S. subscription VOD revenue: Grew 18% year-over-year in 2024 to reach $56.1 billion
Revenue Decline for Traditional TV
Pay TV Revenue Erosion
Traditional TV revenue is shrinking across every metric. Pay TV revenue peaked at $101 billion in 2014 and is projected to drop to approximately $53 billion by 2027 — a $48 billion decline.
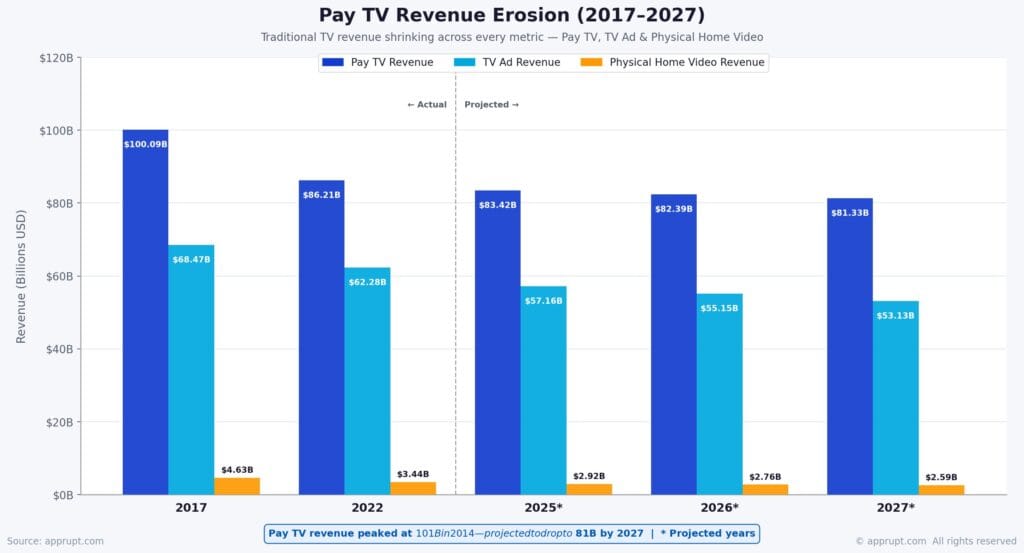
| Year | Pay TV Revenue | TV Ad Revenue | Physical Home Video Revenue |
| 2017 | $100.09B | $68.47B | $4.63B |
| 2022 | $86.21B | $62.28B | $3.44B |
| 2025* | $83.42B | $57.16B | $2.92B |
| 2026* | $82.39B | $55.15B | $2.76B |
| 2027* | $81.33B | $53.13B | $2.59B |
Source: Statista estimates
Cable Advertising Revenue
Cable-network advertising revenue is falling year-over-year, with S&P Global projecting it will drop below $20 billion by 2027, down from $23.6 billion in 2022. Linear TV advertising (local, broadcast, and cable combined) saw a 7% decline in 2025, with a 6% decrease projected for 2026 and an 8% drop forecast for 2027.
PwC’s analysis is even more stark: total U.S. linear TV advertising and pay-TV subscription revenue combined fell 14% between 2020 and 2024, and the sector is expected to decline at a 5% CAGR through 2029.
The Rise of Ad-Supported Streaming
Ad-Tier Adoption Rates
Ad-supported streaming has emerged as a critical growth driver. The share of subscribers on ad-supported tiers grew substantially between Q4 2024 and Q3 2025:
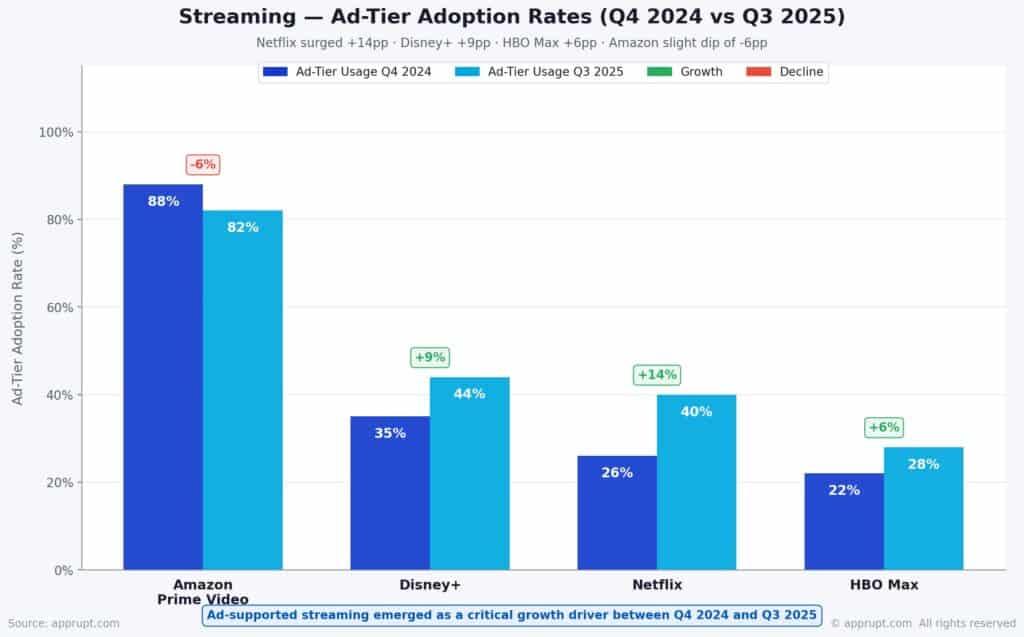
| Platform | Ad-Tier Usage (Q4 2024) | Ad-Tier Usage (Q3 2025) | Growth |
| Amazon Prime Video | 88% | 82% | -6% |
| Disney+ | 35% | 44% | +9% |
| Netflix | 26% | 40% | +14% |
| HBO Max | 22% | 28% | +6% |
Netflix’s ad-supported model has shown remarkable momentum. By November 2025, the platform reported 190 million monthly active ad-tier users worldwide — doubling from 94 million in May 2024. Netflix’s advertising revenue rose more than 250% to over $1.5 billion in 2025.
Free Ad-Supported Streaming TV (FAST)
FAST platforms represent the fastest-growing segment of the streaming market:
- The top three FAST platforms — Roku Channel, Pluto TV, and Tubi — collectively command 5.7% of all U.S. TV viewing as of May 2025
- 45% of U.S. internet households now regularly watch FAST services, up from 30% in 2022
- FAST monthly active households grew 12% year-over-year, with average daily viewing hours per household climbing 16%
- Tubi reached profitability for the first time in Q ending September 2025
- The FAST market is estimated at $14.33 billion in 2026, growing from $12.26 billion in 2025
Sports: Cable’s Last Stronghold Under Siege
Live sports have historically anchored cable subscriptions, but streaming is rapidly closing this gap. A December 2024 survey of 3,753 U.S. sports fans found that streaming is now virtually tied with cable and broadcast as the preferred platform for live sports:
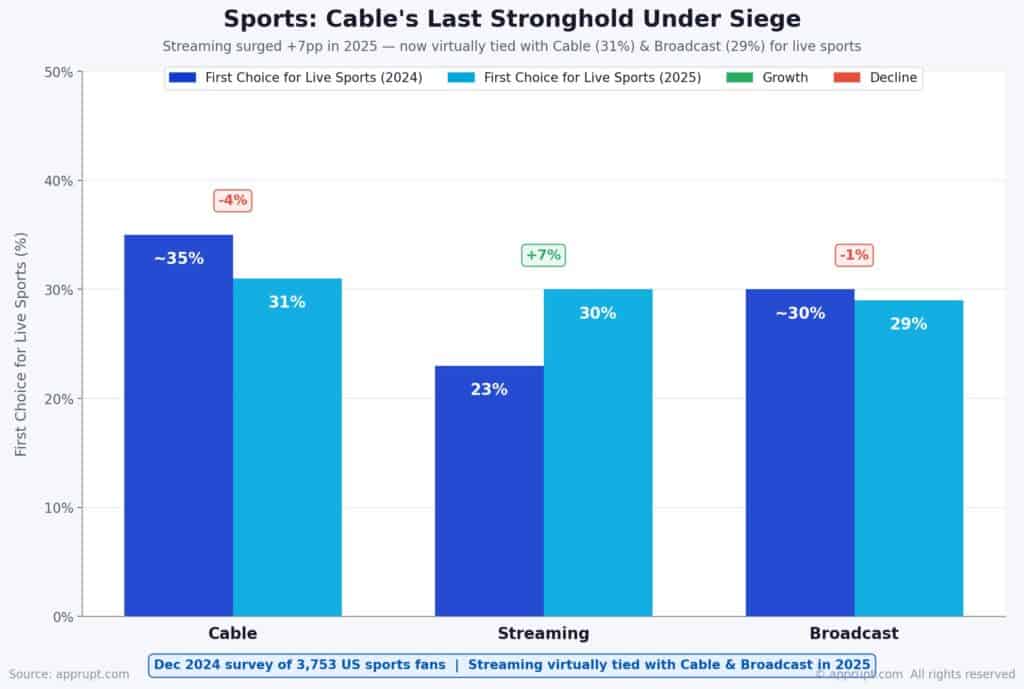
| Platform | First Choice for Live Sports (2024) | First Choice for Live Sports (2025) |
| Cable | ~35% | 31% |
| Streaming | 23% | 30% |
| Broadcast | ~30% | 29% |
Among fans under 35, 48% signed up for a streaming service specifically to watch sports, compared to just 29% of those over 35. Major rights deals are accelerating this shift — NFL on Amazon Prime Video, NBA on ESPN+, NFL Christmas games on Netflix (which drew 30 million viewers each), and the Super Bowl airing on Tubi.
Cost Comparison: Streaming vs. Cable
Monthly Cost Breakdown
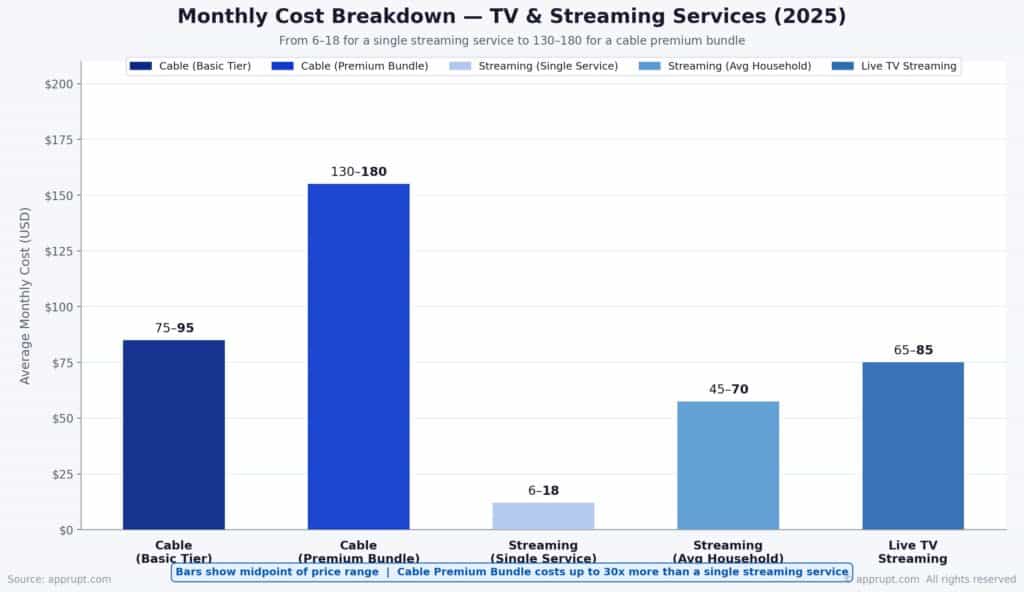
| Service Type | Average Monthly Cost (2025) | Key Features |
| Cable (Basic Tier) | $75–$95 | 100+ channels, local networks, DVR included |
| Cable (Premium Bundle) | $130–$180 | Sports, movie channels, HD/4K |
| Streaming (Single Service) | $6–$18 | On-demand library, original content |
| Streaming (Average Household) | $45–$70 | 3–5 services, mix of ads/no ads |
| Live TV Streaming (YouTube TV, Hulu + Live) | $65–$85 | Live channels, cloud DVR, local stations |
The average American household spends approximately $52 per month on streaming subscriptions, according to a 2025 survey of 1,000 Americans. However, streaming costs are rising — U.S. viewers now pay an average of $69 per month for four streaming services, up 13% from the prior year. Despite this, cord-cutters still generally pay less than cable subscribers, and 86.7% of cord-cutters cite high cable prices as their primary motivation for switching.
Cable’s hidden costs (equipment rental, broadcast surcharges, regional sports fees) often push actual bills $15–$30 above advertised rates.
Why People Cut the Cord
The primary reasons consumers abandon traditional cable are consistent across surveys:
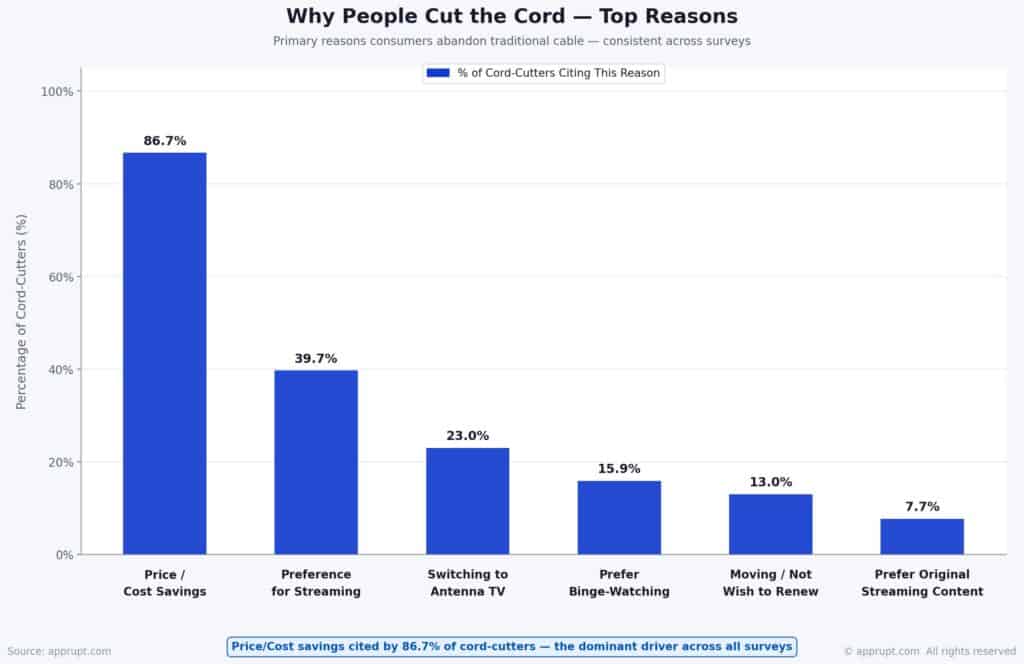
| Reason | Percentage of Cord-Cutters |
| Price/Cost savings | 86.7% |
| Preference for streaming | 39.7% |
| Switching to antenna TV | 23.0% |
| Prefer binge-watching | 15.9% |
| Moving and don’t wish to renew | 13.0% |
| Prefer original streaming content | 7.7% |
Demographics play a strong role: 50% of Americans under 32 have never paid for cable. The “cord-never” generation — those who have never subscribed to traditional pay TV — represents a growing segment that is fundamentally unreachable through traditional TV advertising.
Virtual MVPDs: The Bridge Between Cable and Streaming
Virtual multichannel video programming distributors (vMVPDs) like YouTube TV, Hulu + Live TV, and Sling TV occupy a middle ground, offering live TV channels via streaming. YouTube TV dominates this space:
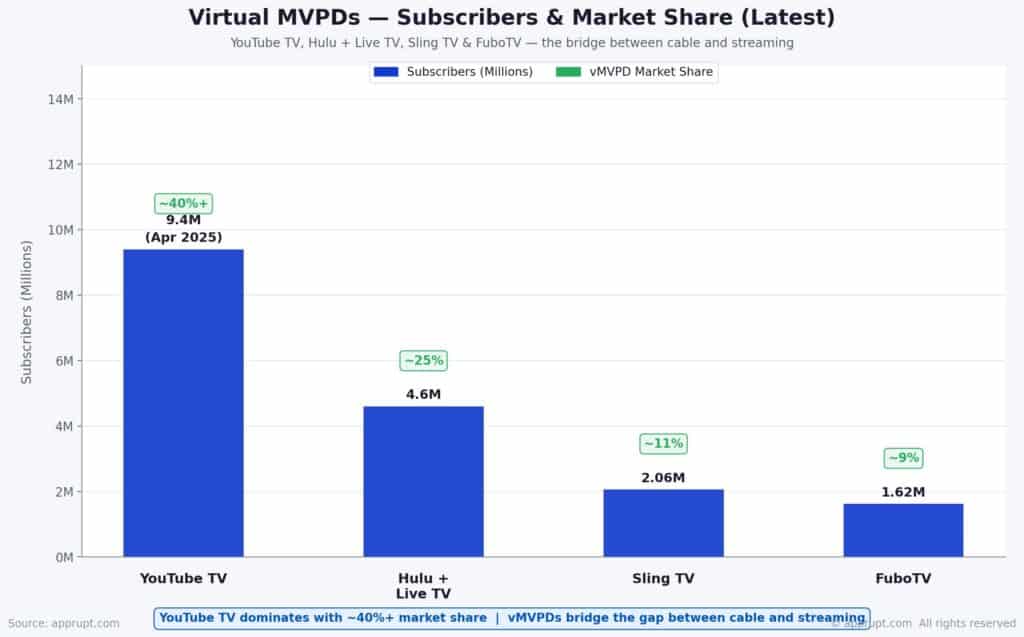
| vMVPD Service | Subscribers (Latest) | Market Share |
| YouTube TV | 9.4 million (April 2025) | ~40%+ |
| Hulu + Live TV | 4.6 million | ~25% |
| Sling TV | 2.06 million | ~11% |
| FuboTV | 1.62 million | ~9% |
YouTube TV is forecast to become the largest pay-TV distributor in the U.S. by the end of 2026, potentially reaching 12.4 million subscribers as traditional MVPDs continue declining. The platform generated an estimated $6 billion in revenue in 2023, up from $900 million in 2019. However, vMVPD pricing has risen sharply — YouTube TV’s subscription went from $35/month at launch in 2017 to $73/month.
The combined percentage of households with either traditional pay TV or a vMVPD is projected to fall from 63.2% in 2022 to 54.8% by 2026.
India’s Pay TV Decline
India mirrors the global trend with its own cable downturn. India’s pay-TV subscriber base fell from 151 million in 2018 to 111 million in 2024, and is expected to drop further to 71–81 million by 2030. The decline has resulted in an estimated 577,000 cumulative job losses in the cable television industry between 2018 and 2025.
Private DTH subscribers in India have experienced a sharp 9% fall in FY25, with the base expected to dip below 51 million by the end of FY26. Meanwhile, IPTV services have gained traction, with subscribers nearly quadrupling to 2.13 million by September 2025.
Future Projections (2026–2030)
Streaming Growth Trajectory
- Streaming will sustain 50%+ of U.S. TV viewing on a regular monthly basis within 2026. Nielsen already recorded two days above 50% in December 2025.
- U.S. streaming market revenue is projected to reach over $112 billion by 2029, a 33% increase from 2024.
- Global video streaming market is projected to grow from $212.83 billion in 2026 to $356.2 billion by 2031.
- Nearly 58% of worldwide digital video viewers will watch subscription OTT services in 2026.
- FAST market is expected to reach $27.14 billion by 2030, up from $12.26 billion in 2025.
Cable’s Continued Decline
- Pay TV subscribers are expected to fall to approximately 60 million in 2027, down from 105 million in 2010.
- Pay TV revenue is projected to decline to $53 billion by 2027, roughly half of its $101 billion peak in 2014.
- Pay TV penetration is expected to drop to 32% of U.S. homes by 2028.
- Cable ad revenue will fall below $20 billion by 2027.
- Linear TV advertising faces a 6% decline in 2026 and an 8% drop in 2027.
Convergence and Hybrid Models
Traditional TV won’t vanish entirely, but its role is narrowing to live events, news, and older demographics. Cable operators are responding with hybrid strategies — bundling streaming apps with pay-TV packages and pivoting to broadband and mobile services. The convergence of streaming and traditional TV economics (ad-supported tiers, live sports on streaming, FAST channels mimicking linear TV) suggests that the distinction between “cable” and “streaming” will continue to blur.
Conclusion
The data paints an unambiguous picture: streaming has decisively won the battle for U.S. television viewership. With 47.5% of all TV viewing in December 2025 and cable at just 20.2%, the gap is widening, not narrowing. By 2026, over 80 million U.S. households will have cut the cord, pay TV penetration will fall below 43%, and streaming platforms will capture an ever-larger share of both viewership and advertising revenue. While cable retains relevance in live sports and older demographics, its structural decline shows no signs of reversal. The question is no longer whether streaming will dominate — it already does — but how quickly the remaining cable infrastructure will be repurposed, spun off, or retired.