The global pay TV industry is at an inflection point. While global market revenue continues to grow — estimated between $206 billion and $222 billion in 2025 depending on the source — the growth is largely driven by IPTV expansion in developing markets and higher ARPUs, masking a deep structural decline in traditional cable and satellite subscribers across mature markets. In the United States, pay TV penetration collapsed from over 80% in 2011 to just 34.4% by the end of 2024, marking nine consecutive years of decline. Globally, pay TV subscribers dropped from 1.013 billion in 2021 to an estimated 985 million in 2023. The coming years will see further erosion of traditional cable and satellite, offset partially by explosive IPTV growth and the ongoing convergence of pay TV with streaming services. This report provides a comprehensive data-driven overview of where the pay TV industry stands in 2026 and where it’s heading.
Global Pay TV Market Size
Revenue Estimates and Forecasts
Multiple research firms have published market size estimates for the global pay TV industry, though they vary depending on methodology and what they include (cable, satellite, IPTV, vMVPDs, or combinations):
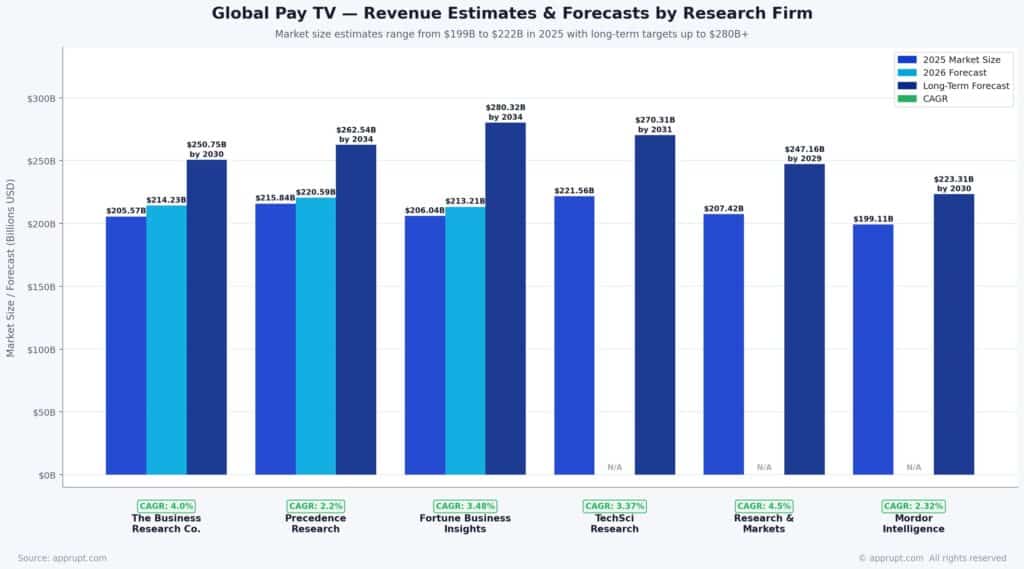
| Source | 2025 Market Size | 2026 Forecast | Long-Term Forecast | CAGR |
| The Business Research Company | $205.57B | $214.23B | $250.75B by 2030 | 4.0% |
| Precedence Research | $215.84B | $220.59B | $262.54B by 2034 | 2.2% |
| Fortune Business Insights | $206.04B | $213.21B | $280.32B by 2034 | 3.48% |
| TechSci Research | $221.56B | — | $270.31B by 2031 | 3.37% |
| Research and Markets | $207.42B | — | $247.16B by 2029 | 4.5% |
| Mordor Intelligence | $199.11B | — | $223.31B by 2030 | 2.32% |
The range of estimates — $199B to $222B for 2025 — reflects differing definitions of “pay TV.” Some include vMVPDs and IPTV alongside traditional cable and satellite, while others focus narrowly on legacy platforms. The consensus, however, is clear: the global pay TV market is growing at a modest 2%–4.5% CAGR, driven primarily by developing market expansion and IPTV adoption rather than traditional cable or satellite growth.
Pay TV Services Revenue
Pay TV services revenue (a more narrow definition focusing on subscription and on-demand services) was valued at $124.83 billion in 2024 and is projected to reach $171.2 billion by 2030. Caretta Research projects that global broadcast and pay TV will lose $42 billion in revenue between 2024 and 2029, while streaming is expected to gain $93 billion (41%) over the same period.
Global Pay TV Subscribers
Overall Subscriber Trends
Global pay TV subscribers peaked above 1 billion in 2018 and have been declining since:
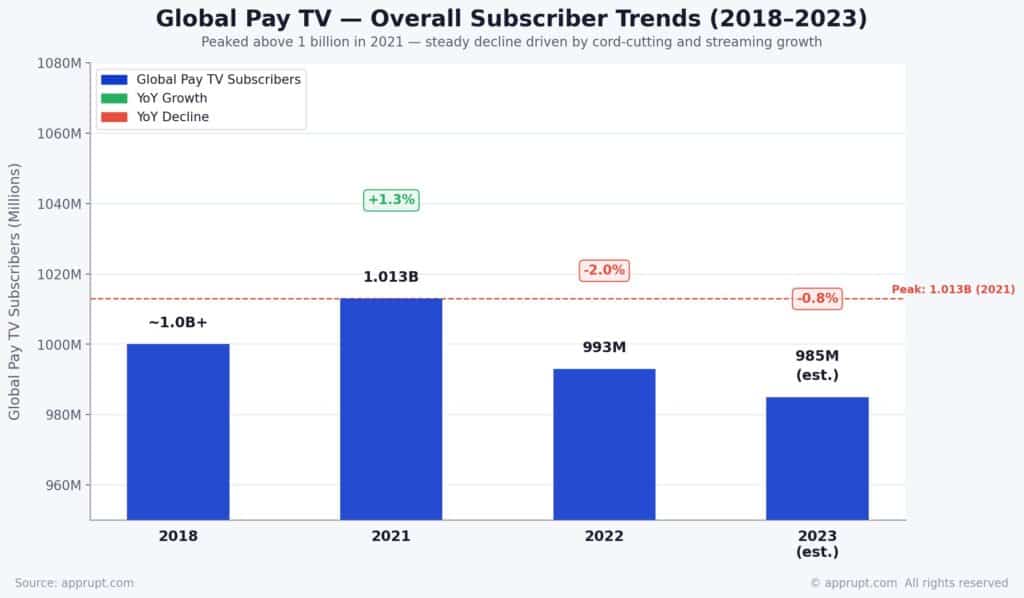
| Year | Global Pay TV Subscribers |
| 2018 | ~1.0 billion+ |
| 2021 | 1.013 billion |
| 2022 | 993 million |
| 2023 | 985 million (estimated) |
Digital TV Research forecast that between 2021 and 2027, 86 countries would add pay TV subscribers while 52 countries would lose them. The net result: 19 million additional subscribers globally, but a $25 billion decline in revenue, since most gains come from developing nations with low ARPUs. The U.S. alone is projected to lose $19 billion in pay TV revenue during this period.
Subscriber Split by Technology
The technology composition of pay TV is shifting decisively toward IPTV and away from cable and satellite:
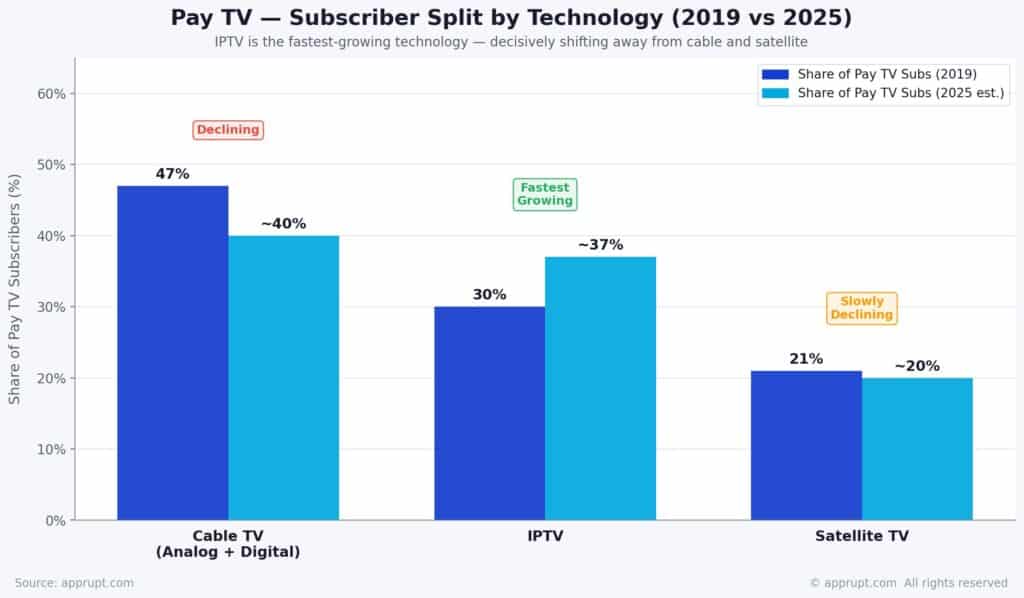
| Technology | Share of Pay TV Subs (2019) | Share of Pay TV Subs (2025 est.) | Trend |
| Cable TV (analog + digital) | 47% | ~40% | Declining |
| IPTV | 30% | ~37% | Fastest growing |
| Satellite TV | 21% | ~20% | Slowly declining |
IPTV is the undisputed growth engine. Digital TV Research forecasts IPTV will add 84 million subscribers between 2019 and 2025, taking its global total to 391 million. Satellite TV is projected to lose 10 million subscribers between 2021 and 2027, while satellite revenues will drop by $14 billion and digital cable revenues by $10 billion.
U.S. Pay TV: The Epicenter of Decline
Penetration Rate Collapse
The U.S. represents the most dramatic pay TV decline of any major market. S&P Global Market Intelligence reports that pay TV penetration fell to 34.4% by the end of 2024, marking the ninth consecutive year of subscriber losses. The trajectory has been steep:
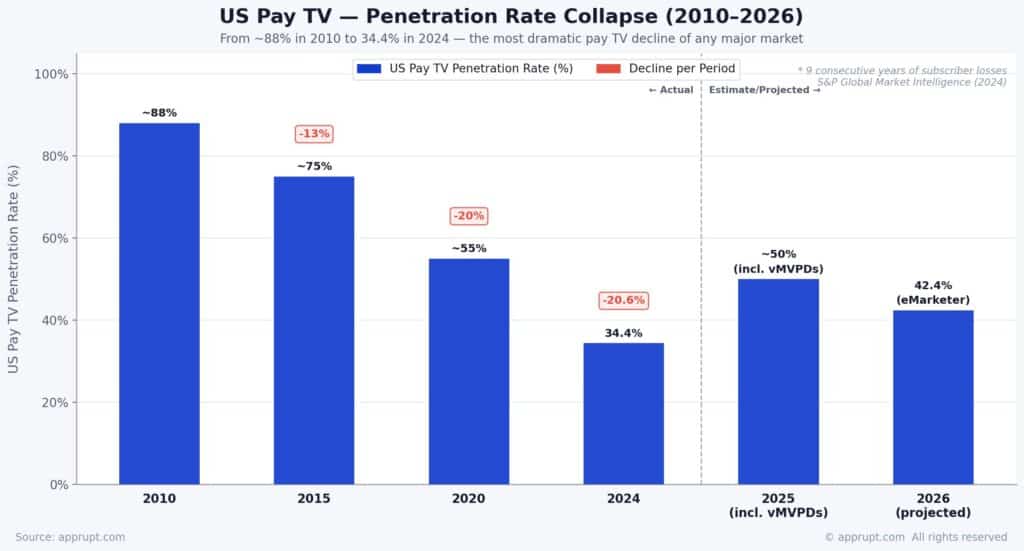
| Year | U.S. Pay TV Penetration Rate |
| 2010 | ~88% |
| 2015 | ~75% |
| 2020 | ~55% |
| 2024 | 34.4% |
| 2025 | ~50% (including vMVPDs) |
| 2026 (projected) | 42.4% (eMarketer, including vMVPDs) |
When vMVPDs (YouTube TV, Hulu + Live TV, etc.) are included, overall pay TV penetration stands around 50% — meaning half of U.S. households have cut the cord entirely. When counting only traditional cable, satellite, and telco TV, penetration is at 34.4%. By 2028, GlobalData projects traditional pay TV penetration will fall to just 32% of U.S. homes.
Basic cable networks lost subscribers at an average rate of 7.1% in 2024 alone. S&P projects the average cable network will continue losing 5.4% of its subscribers annually from 2025 through 2029.
U.S. Pay TV Subscriber Count
The number of U.S. cable TV subscribers has been in freefall from its 2010 peak of 105 million:
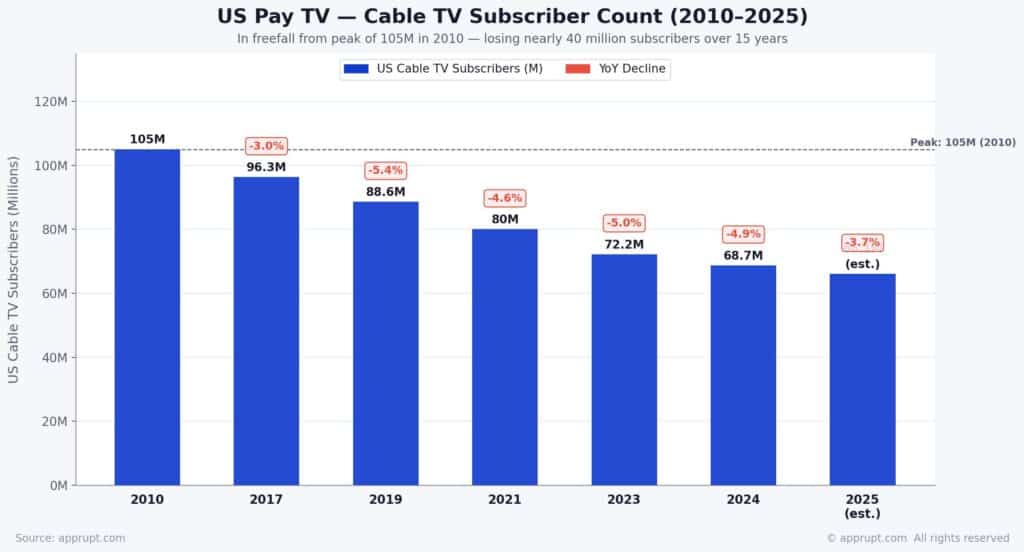
| Year | U.S. Cable TV Subscribers | YoY Decline |
| 2010 | 105 million | — |
| 2017 | 96.3 million | 3.0% |
| 2019 | 88.6 million | 5.4% |
| 2021 | 80 million | 4.6% |
| 2023 | 72.2 million | 5.0% |
| 2024 | 68.7 million | 4.9% |
| 2025 | 66.1 million (est.) | 3.7% |
In just 15 years, pay TV has lost over a third of its customer base. By 2026, over 80.7 million U.S. households are projected to be non-pay-TV homes, outnumbering the 54.3 million that still subscribe.
Top U.S. Pay TV Operators
Current Rankings (End of 2025)
According to Omdia forecasts published via BusinessWire, the top three U.S. pay TV operators at the end of 2025 are:
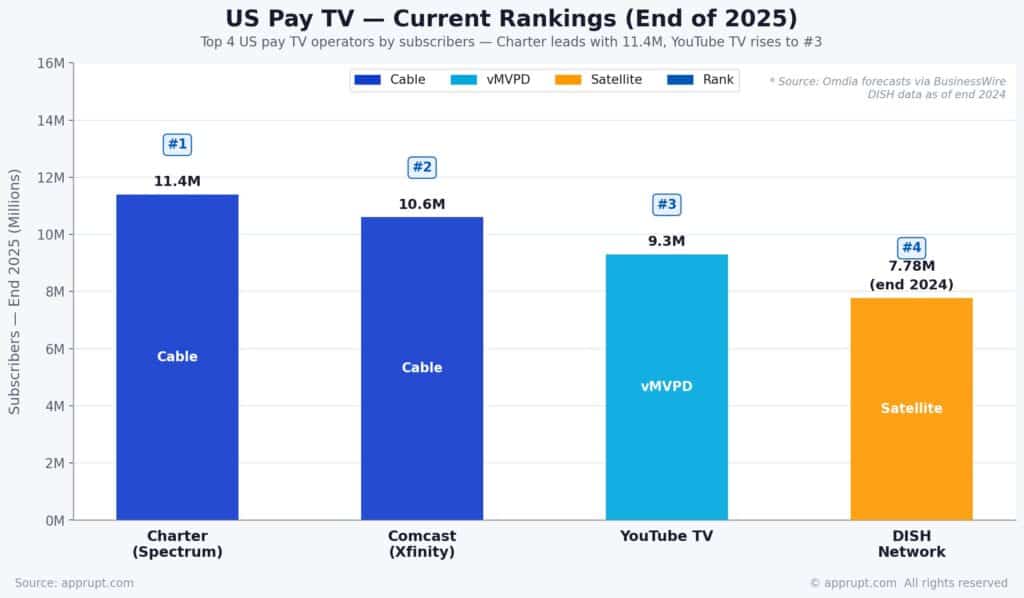
| Rank | Operator | Subscribers (End 2025) | Type |
| 1 | Charter (Spectrum) | 11.4 million | Cable |
| 2 | Comcast (Xfinity) | 10.6 million | Cable |
| 3 | YouTube TV | 9.3 million | vMVPD |
| 4 | DISH Network | 7.78 million (end 2024) | Satellite |
YouTube TV is the third-largest pay TV operator in the U.S. today and is on track to become the largest by 2027, with a projected subscriber base of 10.4 million, surpassing both Charter (10.0 million) and Comcast (9.2 million). This will mark the first time a virtual pay TV provider claims the top position in the U.S. market.
Subscriber Loss Trajectory
The pace of subscriber losses at major cable operators has been relentless:
- Comcast lost 1.15 million TV subscribers in full-year 2025, ending with 11.27 million — losing roughly 3,500 TV customers per day
- Comcast and Charter combined lost over 606,000 TV customers in Q1 2025 alone
- Charter lost 255,000 TV subscribers in 2025, after losing 1.2 million in 2024
- DISH Network reported 7.778 million pay TV subscribers at the end of 2024, including 5.686 million DISH TV and 2.092 million Sling TV customers
- Satellite providers collectively lost over 20 million U.S. subscribers since 2014
The Charter-Cox Merger
In response to the structural decline, Charter Communications announced a $34.5 billion acquisition of Cox Communications, forming a telecom giant with over 38 million customers nationwide. The merger is designed to cut costs, streamline operations, and invest in next-generation infrastructure, making the combined entity the largest cable and internet provider in the U.S., surpassing even Comcast.
Pay TV Revenue and Advertising
Revenue Erosion
U.S. pay TV revenue has been in secular decline. TV revenue dropped from $100.09 billion in 2017 to $84.29 billion in 2024 — a 16.5% decline. By 2027, revenue is projected to fall further to $81.33 billion. Pay TV revenue peaked at $101 billion in 2014 and is projected to drop to approximately $53 billion by 2027 according to some estimates — a roughly 50% decline.
PwC’s 2025 Global Entertainment & Media Outlook projects that total consumer spending on combined OTT video and pay TV will grow from $291.3 billion in 2024 to $318.5 billion by 2029, but this growth is entirely streaming-driven.
Advertising Revenue Shift
The advertising revenue picture reveals a stark divergence between linear TV and streaming:
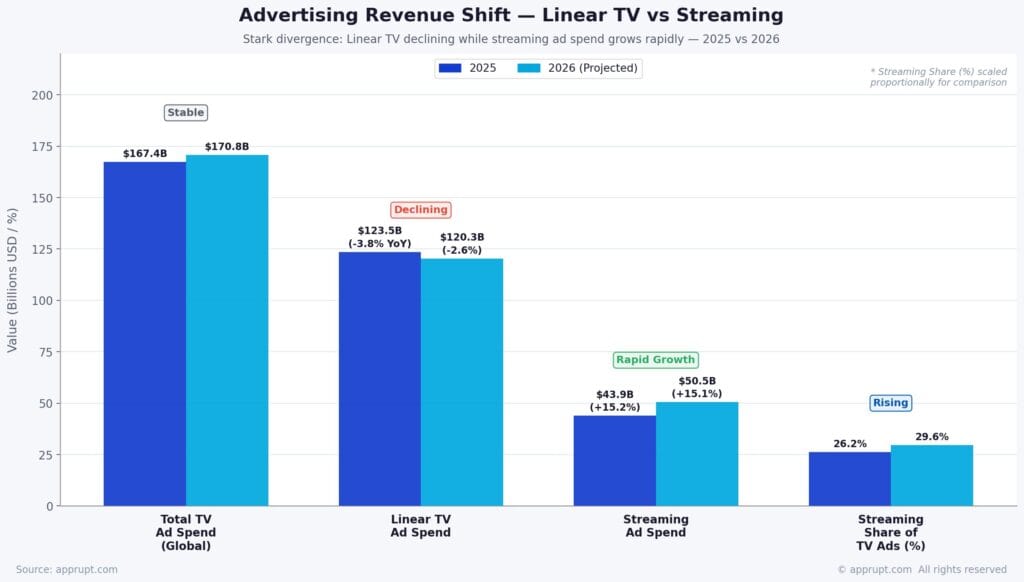
| Metric | 2025 | 2026 (Projected) | Trend |
| Total TV ad spend (global) | $167.4 billion | $170.8 billion | Stable |
| Linear TV ad spend | $123.5 billion (-3.8% YoY) | $120.3 billion (-2.6%) | Declining |
| Streaming ad spend | $43.9 billion (+15.2%) | $50.5 billion (+15.1%) | Rapid growth |
| Streaming share of TV ads | 26.2% | 29.6% | Rising |
Cable TV gross advertising revenue fell to $20.2 billion in 2024, down 5.9% year-over-year. Streaming ad revenue is projected to surpass 30% of total TV ad spend by 2027. The median viewer age for cable and broadcast TV now stands at 64.6 years, underscoring the demographic challenge facing traditional TV advertisers.
IPTV: The Growth Engine
Market Size and Subscriber Growth
Internet Protocol Television (IPTV) is the only segment within pay TV experiencing significant structural growth. The IPTV market is valued at $58.51 billion in 2025 and expected to reach $211.80 billion by 2033, growing at a robust 17.46% CAGR. As of 2026, the IPTV market is projected to reach $187.01 billion with over 250 million global subscribers.
Key IPTV statistics:
- China leads global IPTV with approximately 380 million subscriptions: China Telecom (195 million), China Mobile (110 million), and China Unicom (75 million)
- Asia-Pacific accounts for 45.89% of global IPTV revenue
- India added 2 million new IPTV subscribers per month by mid-2025, with the fiber base crossing 35 million lines
- Subscription-based IPTV dominated with a 72.7% revenue share in 2023
- Smart TVs earned 48.20% of device revenue in 2025, with 220 million units shipped that year
The IPTV market is projected to nearly double to $421.53 billion by 2030 at a 17.4% CAGR, driven by 5G networks, AI-powered content recommendations, and cloud-based solutions.
U.S. ARPU and Cost Economics
Average Revenue Per User
As of 2023, the average revenue per user (ARPU) for a U.S. pay TV service was approximately $107 per month. This is notably higher than the combined ARPU of a self-bundled streaming package including Netflix, Amazon Prime Video, Disney+, and leading sports services. However, as streaming platforms raise prices and add ad tiers, the ARPU gap is narrowing.
In India, the dynamics are quite different. ARPU remains far lower than in developed markets, but ICRA expects 1%–3% ARPU growth in FY2026, partially offsetting subscriber losses through bundled and premium offerings (HD, 4K, live events).
Regional Analysis
North America
North America dominated the global pay TV market with approximately 41% market share in 2024. The U.S. pay TV market is estimated at $62.08 billion in 2025 and projected to reach $75.99 billion by 2034 at a 2.27% CAGR. Despite subscriber losses, premium subscription models and high ARPUs sustain revenue. The competitive landscape is being reshaped by the Charter-Cox merger and YouTube TV’s rise to potential market leadership.
Europe
Eastern Europe’s pay TV market is showing signs of broader stagnation. By 2025, eight markets reported subscriber declines — up from just a few previously saturated markets. In Poland, streaming subscriptions rose to 11.6 million, exceeding traditional multichannel subscriptions entirely. Fixed broadband penetration across the region averaged 65.8% in 2025 and is projected to climb to 73.5% by 2031, further enabling the cord-cutting shift.
Asia-Pacific
Asia-Pacific is the fastest-growing pay TV region globally, driven by massive IPTV adoption, particularly in China and India. China remains the world’s largest pay TV market by subscriber volume, projected to hold approximately 315 million subscribers by end-2026 — nearly one-third of the world’s total. India, despite its large base of ~190 million TV households, is experiencing a sharp pay TV contraction.
India: A Case Study in Pay TV Decline
India’s pay TV story mirrors — and in some ways exceeds — the U.S. trajectory in severity:
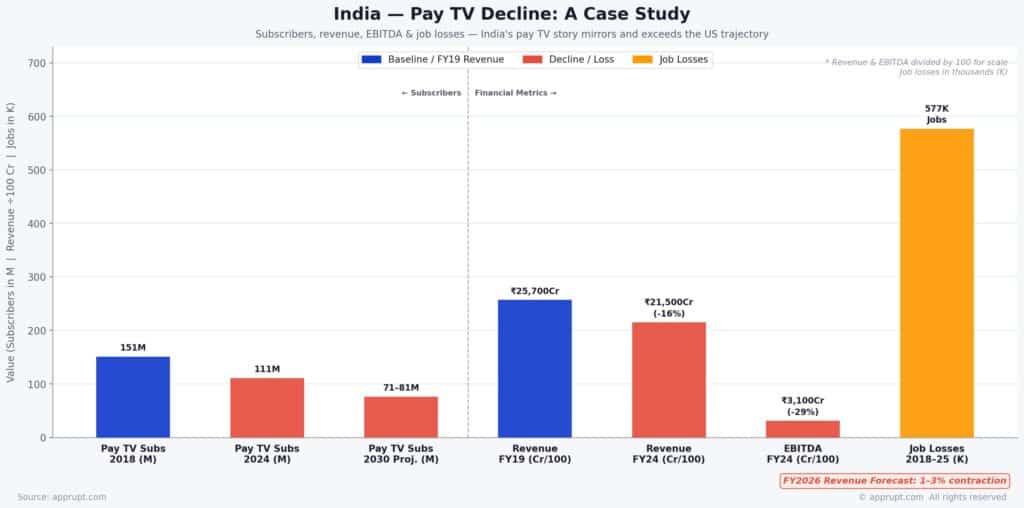
| Metric | Data |
| Pay TV subscribers (2018) | 151 million |
| Pay TV subscribers (2024) | 111 million |
| Pay TV subscribers (2030 projection) | 71–81 million |
| Combined revenue (FY19) | ₹25,700 crore |
| Combined revenue (FY24) | ₹21,500 crore (-16%) |
| EBITDA decline (FY19–FY24) | 29% (to ₹3,100 crore) |
| Cumulative job losses (2018–2025) | 577,000 |
| FY2026 revenue forecast | 1–3% contraction |
The decline is driven by rising channel costs, competition from OTT platforms, and the growing popularity of free-to-air services like DD Free Dish. India’s pay TV broadcasters have cut nearly half their workforce over the past decade — DishTV reduced its permanent staff from 1,020 in 2015 to just 344 in 2025, while Sun TV Network’s headcount fell from 1,906 to 932.
Hiring has not stopped entirely, but it has shifted dramatically toward data analytics, digital product management, performance marketing, and revenue optimization roles, with traditional broadcast positions (programming, scheduling, transmission, ad sales) falling by more than half compared to pre-2019 levels.
Key Industry Trends (2026 and Beyond)
Hybrid Bundling and Convergence
The distinction between pay TV and streaming is blurring rapidly. Approximately 25% of streaming platforms globally are engaged in active bundling arrangements, with over 75% of those deals tied to telecom operators. A 2025 Hub Entertainment Research study found that 42% of viewers are more likely to retain streaming services when they are part of a bundle.
Pay TV operators are responding by integrating popular streaming apps into their set-top boxes. In 2026, flexible bundling — where operators include streaming services in monthly pay TV, telephony, and broadband packages — is proving its value for customer retention and cost savings. The future model increasingly looks like a hybrid: SVOD + AVOD + FAST channels accessed through a single aggregated interface, whether that’s a cable operator’s box, a smart TV, or a streaming device.
vMVPDs as the New Pay TV
Virtual MVPDs like YouTube TV, Hulu + Live TV, and Sling TV are effectively replacing traditional cable for live TV viewing. YouTube TV alone controls over 40% of the vMVPD market and generated an estimated $6 billion in revenue in 2023, up from $900 million in 2019. As YouTube TV is projected to become the largest pay TV distributor by 2027, the vMVPD category represents the future of the “pay TV” concept — live channels delivered via internet rather than coaxial cable.
The Demographic Cliff
Perhaps the most existential challenge facing traditional pay TV is demographic. Adults aged 65+ are the only age group where a majority (50%) still subscribe to cable. Among adults 18–34, only 33% have cable subscriptions. Half of Americans under 32 have never paid for cable — the “cord-never” generation — and they are fundamentally unreachable through traditional TV distribution.
Content Migration Away from Cable
A decade ago, basic cable networks produced a record 186 scripted original series in a single year. Today, the number of new scripted shows created for traditional cable audiences is virtually zero. Networks have shifted their content investment to streaming platforms, removing one of the last remaining reasons consumers paid for cable. Without original programming, cable’s value proposition is limited to live sports, local news, and inertia among older subscribers.
Future Projections (2026–2030)
Continued Decline in Traditional Pay TV
- U.S. pay TV penetration is projected to fall to 32% of households by 2028
- Average cable network subscriber losses: 5.4% annually through 2029
- Global broadcast + pay TV revenue: expected to lose $42 billion between 2024 and 2029
- Linear TV ad spend: projected to decline from $123.5 billion (2025) to $120.3 billion (2026) and continue falling
- C-SPAN and Food Network (the most widely distributed U.S. cable channels) are each expected to lose 15–20 million subscribers by 2029
Growth Areas Within Pay TV
- IPTV: Projected to reach $421.53 billion by 2030, nearly doubling from current levels
- vMVPDs: YouTube TV alone projected to surpass all traditional cable operators by 2027
- Global pay TV market value: Expected to reach $250–$280 billion by 2030–2034 despite subscriber losses, driven by IPTV, premium content, and ARPU growth in developing markets
- 5G-enabled mobile IPTV: With 5G subscriptions hitting 1.9 billion globally by mid-2025, mobile IPTV viewing is rising at a 15.71% CAGR
Conclusion
The pay TV industry in 2026 is defined by a paradox: global market revenue continues to grow modestly (2%–4.5% CAGR), while the underlying subscriber base and traditional business model are in structural decline. In mature markets like the U.S. and Europe, cord-cutting has hollowed out the cable and satellite segments, with penetration rates plummeting from near-universal coverage to one-third of households. The growth that does exist is overwhelmingly concentrated in IPTV — particularly in China and India — and in virtual MVPDs like YouTube TV, which are redefining what “pay TV” means.
For content creators, advertisers, and media strategists, the actionable insight is clear: traditional pay TV is a shrinking addressable market, especially among younger demographics. The industry’s future lies in hybrid models that blend pay TV infrastructure with streaming convenience, IPTV expansion in developing markets, and ad-supported tiers that monetize the audiences migrating away from linear TV. The companies that survive will be those that successfully bridge the legacy cable world with the streaming-first future.