The U.S. television landscape in 2026 is undergoing its most dramatic transformation in history. Streaming has decisively overtaken traditional TV as the primary way Americans consume video content, capturing 47.5% of all TV viewing in December 2025 — the highest share ever recorded. Over 80 million U.S. households are projected to be cord-cutters or cord-nevers by the end of 2026, outnumbering pay-TV subscribers by a widening margin. Meanwhile, connected TV (CTV) ad spending is on track to hit $38 billion in 2026 and surpass traditional TV ad revenue by 2028. Live sports, ad-supported tiers, and free ad-supported streaming TV (FAST) platforms are reshaping both the economics and the viewer experience of American television.
Streaming’s Record-Breaking Dominance
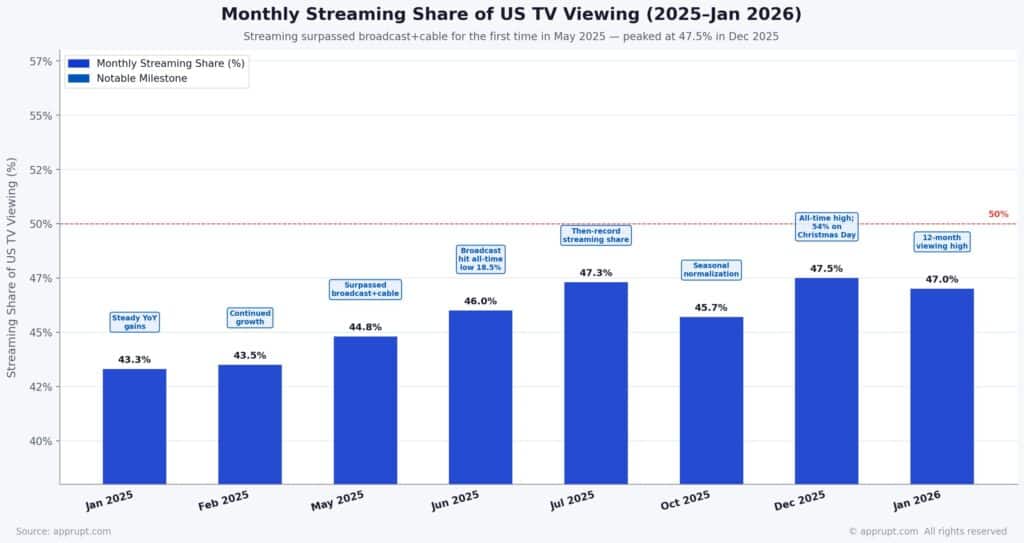
Streaming’s share of U.S. TV viewing has surged from roughly 28% in 2020 to 47.5% in December 2025, shattering multiple records. On Christmas Day 2025, streaming accounted for 54% of all TV usage and generated 55.1 billion viewing minutes — the highest single-day share and the second time streaming surpassed 50 billion minutes in a single day. December 13, 2025, marked the first time streaming exceeded 50% of daily TV usage, hitting 50.4%.
In January 2026, total TV viewing climbed to a 12-month high with streaming holding 47.0% of total usage, a slight dip from December’s peak but still the second-highest monthly figure ever. Analysts project streaming will sustain 50%+ of all TV viewing on a regular basis during 2026 and could reach 55%+ by 2027.
Monthly Streaming Share of U.S. TV Viewing (2025–Jan 2026)
| Month | Streaming Share | Notable Milestone |
| January 2025 | 43.3% | Steady year-on-year gains |
| February 2025 | 43.5% | Continued growth |
| May 2025 | 44.8% | Surpassed combined broadcast + cable for the first time |
| June 2025 | 46.0% | Broadcast hit an all-time low of 18.5% |
| July 2025 | 47.3% | Then-record streaming share |
| October 2025 | 45.7% | Seasonal normalization |
| December 2025 | 47.5% | All-time high; 54% on Christmas Day |
| January 2026 | 47.0% | Total viewing at 12-month high; cable rebounds on sports |
Platform-Level Market Share
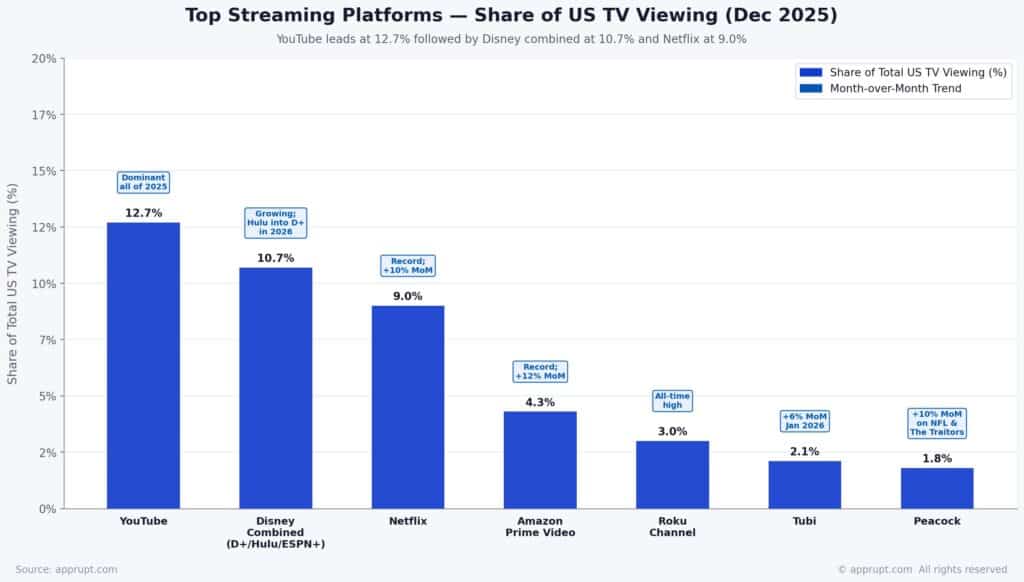
YouTube has emerged as the single largest streaming destination on American television. In December 2025, YouTube commanded 12.7% of all U.S. TV viewing time, surpassing Netflix’s 9.0% share. YouTube maintained the top spot among all media distributors for three consecutive months through April 2025 at 12.4%, and continued leading through the rest of the year.
Top Streaming Platforms by Share of Total U.S. TV Viewing (December 2025)
| Platform | Share of Total TV | Month-over-Month Trend |
| YouTube | 12.7% | Dominant for most of 2025 |
| Netflix | 9.0% | Record; +10% MoM driven by Stranger Things |
| Disney combined (Disney+, Hulu, ESPN+) | 10.7% (combined) | Growing; Hulu integrating into Disney+ in 2026 |
| Amazon Prime Video | 4.3% | Record; +12% MoM |
| Roku Channel | 3.0% | All-time high |
| Tubi | 2.1% | +6% MoM in January 2026 |
| Peacock | 1.8% | +10% MoM in January on NFL and The Traitors |
Cable’s share fell to 20.2% and broadcast to 21.4% in December 2025. In January 2026, cable rebounded to 21.2% (up 9% MoM) driven by ESPN’s College Football Playoff coverage (+82% viewing surge) and cable news gains.
Cord-Cutting and Pay TV Decline
The cord-cutting trend has accelerated dramatically over the past decade and shows no sign of reversing.
Key Cord-Cutting Statistics
- 77.2 million U.S. households had cut the cord as of 2025, more than double the 37.3 million in 2018.
- 80.7 million non-pay-TV households projected by end of 2026, making cord-cutters and cord-nevers the clear majority.
- 68.7 million U.S. households still subscribed to cable TV as of 2025, down from 105 million in 2010.
- 54.3 million pay-TV households expected by 2026, implying a penetration rate of just 42.4%, compared to 88% at cable’s 2010 peak.
- 86.7% of cord-cutters cite high cable costs as the primary reason for switching.
- 50% of Americans under 32 will not pay for cable TV.
Comcast lost 1.15 million TV subscribers in full-year 2025, shedding roughly 3,500 customers per day. Charter and Comcast together lost over 1.3 million pay-TV customers in the first three quarters of 2025 alone.
U.S. Pay TV Household Forecast (Traditional + Digital)
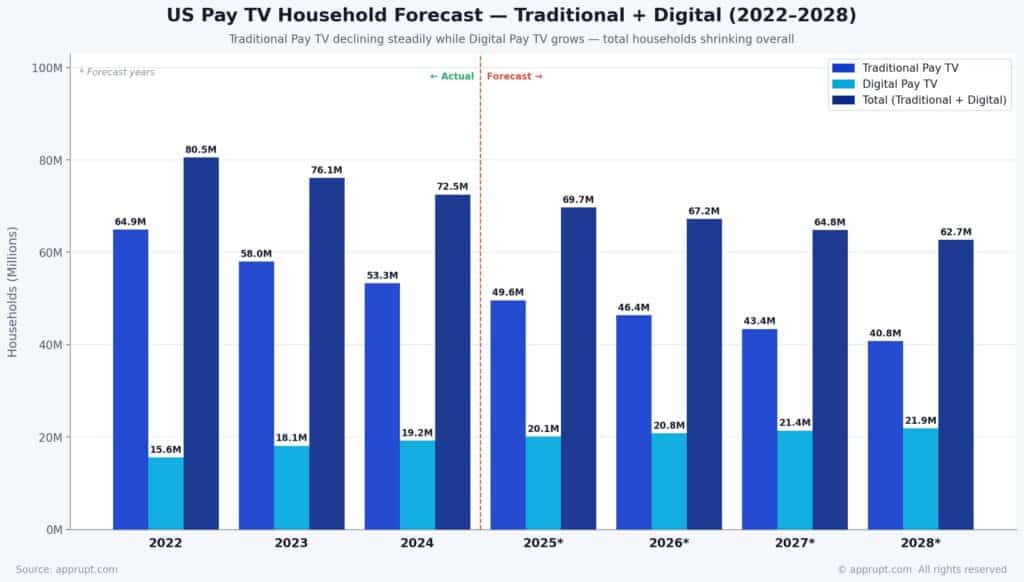
| Year | Traditional Pay TV | Digital Pay TV | Total |
| 2022 | 64.9M | 15.6M | 80.5M |
| 2023 | 58.0M | 18.1M | 76.1M |
| 2024 | 53.3M | 19.2M | 72.5M |
| 2025* | 49.6M | 20.1M | 69.7M |
| 2026* | 46.4M | 20.8M | 67.2M |
| 2027* | 43.4M | 21.4M | 64.8M |
| 2028* | 40.8M | 21.9M | 62.7M |
*Projected figures. By 2028, only about 40.8 million U.S. households are expected to pay for traditional TV services. PwC projects that by 2029, merely 28.8% of American households will maintain pay-TV subscriptions.
Pay TV Revenue Trajectory
Pay TV has hemorrhaged revenue alongside subscribers. TV revenue fell from $100.09 billion in 2017 to $84.29 billion in 2024, a 16.5% decline. By 2027, revenue is projected to drop further to $81.33 billion. Grand View Research estimates the U.S. pay TV market will contract from $80.5 billion in 2021 to $63.8 billion by 2028, a CAGR of -3.3%. Total revenue from linear TV advertising and pay-TV subscriptions combined amounted to $126.1 billion in 2024, down 14% from 2020, and is expected to decline at a ~5% CAGR through 2029.
Time Spent Watching TV
Despite the platform shift, Americans continue devoting substantial time to TV content. The average U.S. adult watches approximately 3.7 hours of television per day, adding up to nearly 26 hours per week. Total daily TV time (including streaming, cable, and broadcast) is expected to exceed five hours in 2026 when digital video on TV screens is included.
Traditional vs. Digital Viewing Time
- 2025: U.S. adults spend an average of 2 hours 29 minutes per day on traditional TV, still the single leading media activity.
- 2026: Traditional TV time is forecast to drop to 2 hours 14 minutes per day — the final year linear TV will rank as the No. 1 media activity in the U.S.
- 2027: Subscription OTT streaming is projected to overtake traditional TV as the top media activity.
- U.S. adults are expected to spend about 39% of their daily viewing time on traditional TV in 2026, with the remainder shifting to digital and streaming video.
Age-Based Viewing Differences
The generational divide in TV habits is stark. Adults 65+ watch approximately 6.5 hours of TV daily, while adults 18–34 average about 3.5 hours. Only 36% of Gen Z watch two or more hours of TV daily, compared to 73% of Boomers. Over 75% of viewers aged 12–34 spend the majority of their TV time on streaming. Among children, YouTube viewership is forecast to surpass linear TV consumption in 2026.
The Rise of Ad-Supported and FAST Streaming
The growth of ad-supported video on demand (AVOD) and free ad-supported streaming TV (FAST) has become one of the defining trends in U.S. television.
AVOD and Ad-Tier Adoption
Ad-supported content captured 73.6% of total TV viewing in Q2 2025, up 1.2 percentage points from the prior quarter. Netflix’s ad-supported plan now accounts for 45% of total U.S. household viewing hours, up sharply from 34% just one year earlier. Globally, 40% of active Netflix accounts are on the ad-supported tier, up from 26% in Q4 2024. Netflix reports over 190 million monthly active viewers on its ad tier worldwide.
Disney+ saw ad-tier adoption rise from 35% to 44% of accounts, while HBO Max went from 22% to 28% during the same period. Amazon Prime Video leads all platforms in ad-tier usage, with 82% of subscribers on ad-supported plans.
FAST Platform Growth
FAST platforms have moved firmly into the mainstream:
- FAST services collectively captured 5.7% of total U.S. TV viewing in May 2025 — more than any individual broadcast network.
- 45% of U.S. internet households now watch FAST, up from 30% in 2022.
- Total hours watched across major FAST services grew 43% year-over-year in 2025.
- FAST viewership session lengths jumped 25% from the prior year.
- Tubi reached 100 million monthly active users by mid-2025.
- U.S. FAST advertising revenue is projected at $5.78 billion in 2025, with an expected CAGR of 16.9% through 2033.
- FAST viewers are projected to grow from 116.8 million in 2025 to 129.6 million by 2029.
Consumer cost-sensitivity is a key driver: 42% of paid streaming users feel they overspend on subscriptions and 35% plan to cancel at least one service, pushing many toward ad-supported alternatives.
Subscription Trends and Churn
Subscription Volume and Spending
U.S. streaming subscriptions reached 339 million in Q2 2025, up 10% year-over-year. The average North American household now subscribes to seven streaming services, up from five a year earlier. Average monthly spending on video and TV services has risen to $169.12 per household, up from $140.06 in Q2 2024.
Parks Associates forecasts total U.S. TV and video subscriptions will climb from 719 million in 2025 to 765 million by 2030, with total subscription revenue rising from $186.5 billion to $190.7 billion. Netflix surpassed 325 million global subscribers by end of 2025.
Subscription Fatigue and Churn
Despite growing subscriptions, churn is accelerating. Monthly churn rates across streaming services jumped from 2% in 2019 to 5.5% by early 2025, with nearly half of all subscribers canceling at least one service annually. Among Gen Z, 37% have canceled at least one subscription since December 2025 due to subscription fatigue, and 80% have signed up for a service to watch a specific show then canceled afterward. Roughly 23% of U.S. streaming subscribers are “serial churners” who cancel three or more services in a two-year period.
Live Sports: The Battleground
Live sports remain the single most important content category for both traditional TV and streaming, and the shift to digital delivery is accelerating.
- 88% of Americans say they watch live sports, with 47% watching primarily via live TV streaming apps, ahead of 33% who use cable/satellite.
- 70% of U.S. sports viewers use a streaming service to watch, with 33% using a sports-specific streamer such as NFL+, MLB.TV, or ESPN+.
- Digital live sports viewers surpassed traditional cable viewers in 2023 and are projected to reach 127.4 million by 2027, while cable sports viewing is expected to fall to 75.4 million.
- Digital live sports audiences are projected to grow 5.8% in 2026, far outpacing overall live sports viewership growth of just 0.4%.
- Live sports and events drove 60% of the most significant streaming sign-up spikes in 2025; sports alone accounted for 85% of live-driven sign-ups.
- Netflix’s Christmas Day 2025 NFL broadcast generated 430,000 new U.S. subscribers. Ads in streaming-exclusive NFL games delivered 66% higher effectiveness than cable/broadcast averages.
Despite streaming’s growth, nearly 90% of total sports viewing still happens on traditional TV or MVPDs, underscoring that the transition, while rapid, is not yet complete.
Connected TV and Advertising Market
CTV Ad Spending Trajectory
CTV advertising has been the fastest-growing major ad channel in the U.S., surging from roughly $8 billion in 2020 to $33.35 billion in 2025. Key forecasts include:
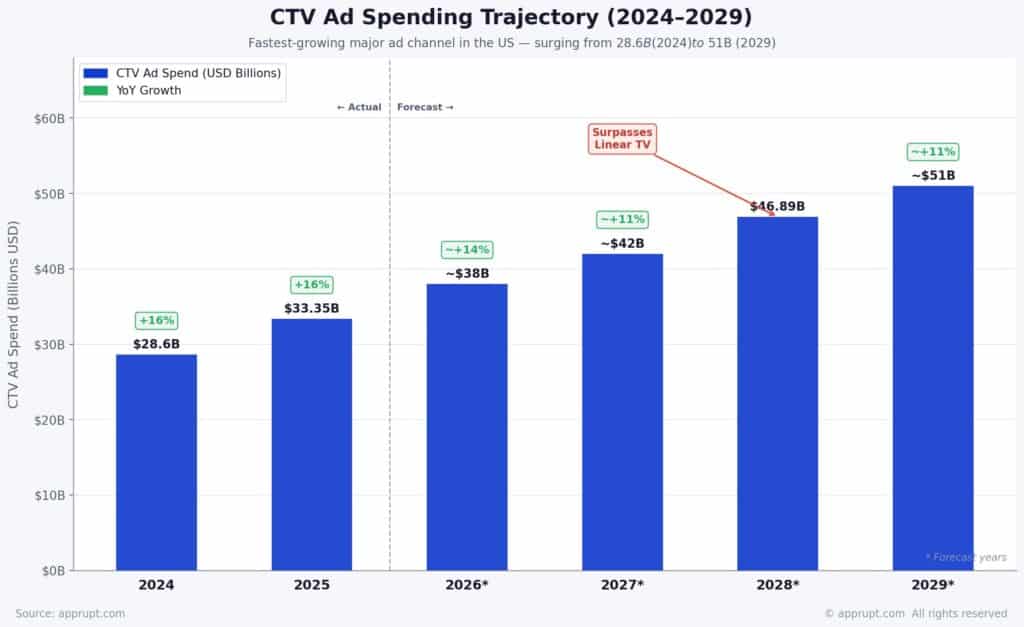
| Year | CTV Ad Spend | YoY Growth |
| 2024 | $28.6B | 16% |
| 2025 | $33.35B | 16% |
| 2026 | ~$38B | ~14% |
| 2027 | ~$42B | ~11% |
| 2028 | $46.89B | — Surpasses linear TV |
| 2029 | ~$51B | ~11% |
The IAB projects total U.S. ad spend will grow 9.5% in 2026, with CTV leading at 13.8% growth. By contrast, linear TV ad spending declined 14.4% in 2025 and is expected to moderate to a 1.7% decline in 2026, buoyed by the Winter Olympics, FIFA World Cup, and U.S. midterm elections.
CTV Adoption
Connected TV devices now reach 96.4 million U.S. households, with 117 million using CTV at least monthly as of 2025. CTV penetration stands at about 90% of all U.S. households. Smart TVs dominate as the primary streaming device, used by 81% of viewers. By 2027, more than 75% of U.S. CTV users are expected to stream via built-in smart TV apps rather than external devices.
Content Production and Industry Consolidation
Scripted Content Decline
The number of original TV series has declined for three consecutive years following “Peak TV” in 2022. Total U.S.-produced show debuts fell to 1,122 in 2025, down 11% from 2024 and one-third below the 2022 peak of 1,695. Broadcast networks saw the steepest drop at 21%, while streaming content fell approximately 11%. Traditional cable networks have largely stopped investing in original scripted programming.
Industry Consolidation
Major structural changes are reshaping the industry. The Charter-Cox $34.5 billion merger is creating the largest cable and internet provider in the U.S. with over 38 million customers. Comcast announced plans to spin off most of its cable TV assets, retaining only NBC, Peacock, and Bravo. Hulu is integrating with Disney+ in 2026, with their combined annual U.S. ad revenue expected to surpass $3 billion.
The U.S. Streaming Video Market Outlook
The U.S. OTT video market is projected to grow at a 5.9% CAGR over the next five years, potentially reaching $112 billion in revenue by 2029, up 33% from $84.7 billion in 2024. Subscription VOD revenue reached $56.1 billion in 2024, growing 18% year-over-year. FAST is growing even faster, on pace for a 13.8% CAGR through 2029, reaching $9 billion in U.S. revenue.
Over 260 million Americans — more than 77% of the population — watch OTT video, with YouTube as the most-used platform. The number of individual CTV viewers in the U.S. reached 234 million in 2024, about 70.5% of the total population.
Key Forecasts: 2026–2030
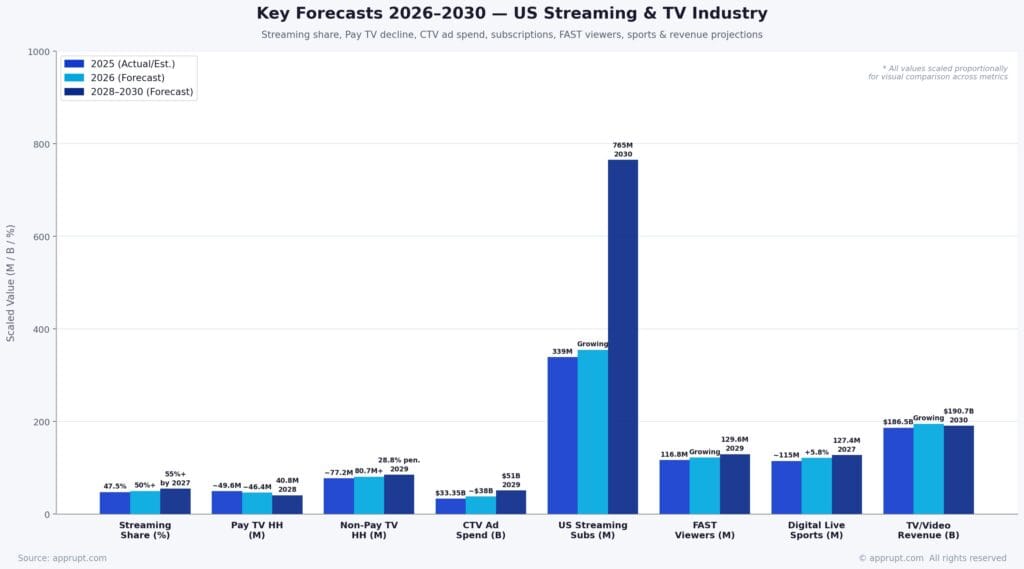
| Metric | 2025 (Actual/Est.) | 2026 (Forecast) | 2028–2030 (Forecast) |
| Streaming share of TV | 47.5% peak | 50%+ sustained | 55%+ by 2027 |
| Pay TV households (traditional) | ~49.6M | ~46.4M | 40.8M by 2028 |
| Non-pay-TV households | ~77.2M | 80.7M+ | Growing; 28.8% pay-TV penetration by 2029 |
| CTV ad spend | $33.35B | ~$38B | $46.89B (2028), ~$51B (2029) |
| U.S. streaming subscriptions | 339M | Growing | 765M total TV/video subs by 2030 |
| FAST viewers | 116.8M | Growing | 129.6M by 2029 |
| Digital live sports viewers | ~115M | +5.8% growth | 127.4M by 2027 |
| Traditional TV daily time | 2:29/day | 2:14/day (last year as No. 1 media) | Sub OTT overtakes in 2027 |
| Total sub TV/video revenue | $186.5B | Growing | $190.7B by 2030 |
Conclusion
The U.S. TV ecosystem is at a tipping point. Streaming’s share crossed the combined broadcast-plus-cable threshold in 2025 and is on track for sustained majority status in 2026. Pay TV’s contraction will continue unabated, with traditional households projected to fall below 41 million by 2028. The economics of television are being rewritten by CTV advertising (approaching $38 billion in 2026), the AVOD/FAST boom, and the migration of live sports to digital platforms. For content creators, advertisers, and consumers alike, the streaming-first era is no longer approaching — it has arrived.