The global live sports streaming market is undergoing a historic transformation as viewers shift from traditional cable and satellite TV to digital platforms. Valued at approximately $33.93 billion in 2024, the sports streaming platform market is projected to grow at a compound annual growth rate (CAGR) of 12.6%–12.88%, reaching between $75 billion and $109 billion by 2030–2033. Streaming platforms are now spending $14.2 billion annually on sports rights alone, with Amazon Prime Video overtaking DAZN as the top spender in 2026.
In the United States, live TV streaming has become the primary way Americans watch sports (47%), surpassing cable and satellite TV (33%). Live sports programming has emerged as the most reliable driver of subscriber acquisition, responsible for 85% of live-driven sign-ups across major platforms in 2025. This report examines market size projections, viewership trends, platform spending, regional dynamics, technology influences, and key challenges shaping the live sports streaming landscape through 2033.
Live Sports Streaming Market Size and Growth Projections
Global Market Valuation
Multiple research firms have issued forecasts for the global sports streaming market, though valuations vary based on scope and methodology. The most widely cited estimates place the market between $33–46 billion as of 2024–2025, with projections ranging from $68 billion to over $108 billion by the early 2030s.
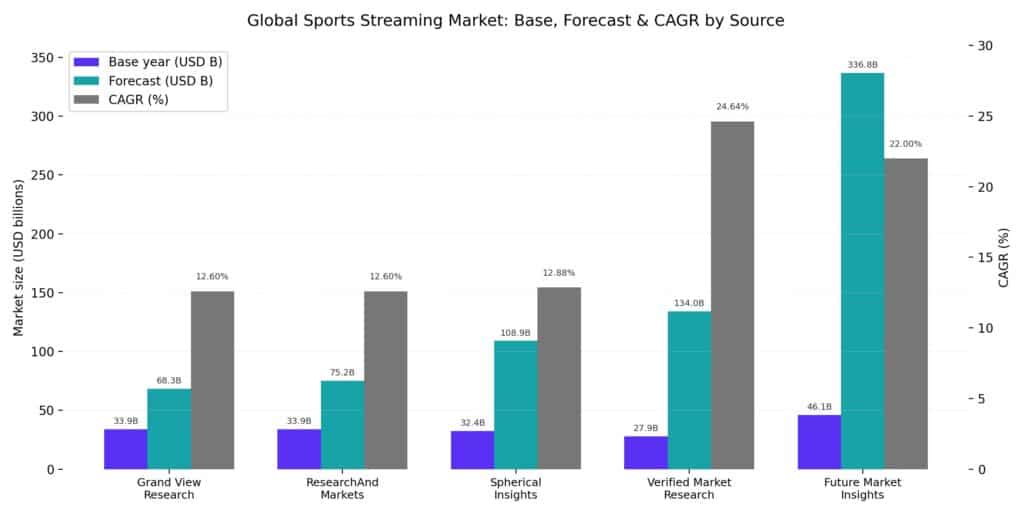
| Source | Base Year Value | Forecast Value | Forecast Year | CAGR |
| Grand View Research | $33.93B (2024) | $68.30B | 2030 | 12.6% |
| ResearchAndMarkets | $33.93B (2024) | $75.17B | 2030 | 12.6% |
| Spherical Insights | $32.43B (2023) | $108.93B | 2033 | 12.88% |
| Verified Market Research | $27.93B (2024) | $133.98B | 2032 | 24.64% |
| Future Market Insights | $46.11B (2025) | $336.81B | 2035 | 22.0% |
Sources:
The consensus among major research firms suggests the market will more than double between 2024 and 2030, driven by cord-cutting trends, expanding OTT adoption, and the growing importance of exclusive live sports content on streaming platforms.
Live Sports as the Dominant Content Segment
Within the broader sports streaming platform market, live sports events accounted for the largest revenue share in 2023 and are expected to maintain their dominance through the forecast period. The live segment’s growth is fueled by increasing partnerships between leagues and streaming platforms, the popularity of exclusive live-streamed events, and rising consumer demand for real-time sports action.
The OTT market’s sports segment is projected to expand at a 12.67% CAGR through 2031, with leagues increasingly favoring direct-to-consumer channels that allow them to monetize both subscription fees and in-stream advertising. Amazon’s exclusive Thursday Night Football deal and Apple’s MLS contract exemplify how exclusive sports events serve as catalysts for subscriber acquisition and churn reduction.
Sports Rights Spending by Streamers
2025–2026 Investment Trends
Streaming platforms are allocating record sums to secure live sports broadcasting rights. In 2025, streaming services collectively spent $13.2 billion on sports rights, representing approximately 20% of the global $64 billion sports rights market. This figure is projected to rise to $14.2 billion in 2026, a 7% year-over-year increase.
The composition of spending has shifted dramatically. In 2026, generalist streamers—including Amazon Prime Video, Netflix, Paramount+, Disney+, and Apple TV—are projected to account for 44% of total streaming spend on sports rights, up from 31% in 2025. This reflects the strategic importance of live sports in driving subscriber growth and maximizing ad-tier revenue for broad entertainment platforms.
Top Streamer Spending Rankings (2026)
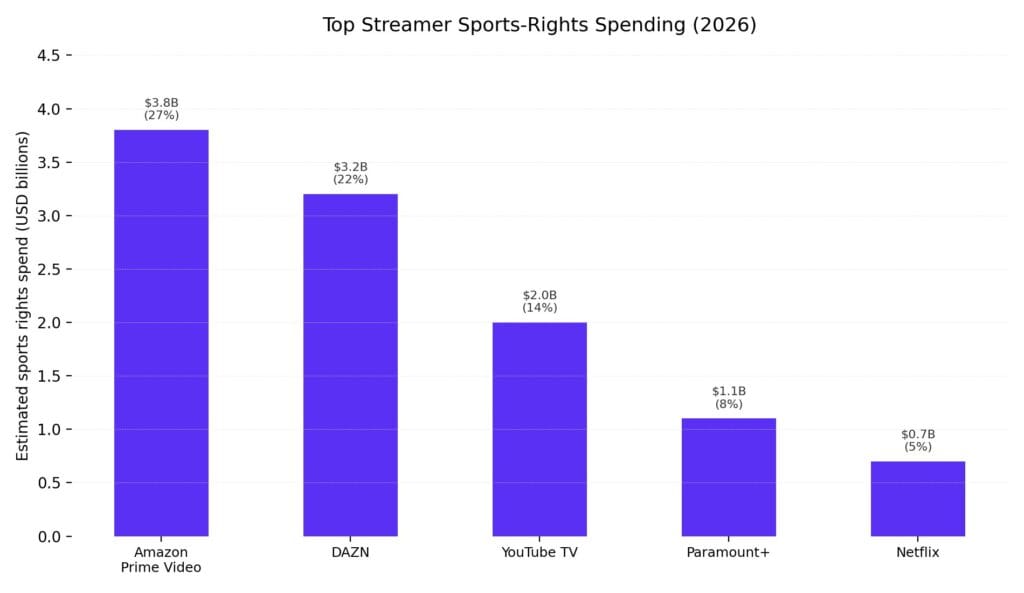
| Rank | Platform | Estimated Spend | Share of Streaming Total | Key Rights |
| 1 | Amazon Prime Video | $3.8B | 27% | NBA (11-yr, $1.8B/yr), NFL Thursday Night Football, UEFA Champions League |
| 2 | DAZN | ~$3.2B | 22% | European football leagues (Germany, Italy, Spain, France) |
| 3 | YouTube TV | ~$2.0B | 14% | NFL Sunday Ticket ($2B/season) |
| 4 | Paramount+ | ~$1.1B | 8% | UFC ($1.1B/yr) |
| 5 | Netflix | ~$0.7B | 5% | NFL Christmas Day games, WWE ($500M/yr) |
Sources:
Amazon’s ascent to the top spending position is largely driven by 2026 being the first full year of its 11-year NBA deal, worth $1.8 billion per season, combined with existing NFL and Champions League commitments. DAZN, which held the top spot since 2018, slipped to second partly because its $1 billion FIFA Men’s Club World Cup deal (which boosted 2025 spending) does not recur in 2026.
U.S. Sports Rights Landscape
Total spending on U.S. sports rights reached $30.5 billion in 2025, a 122% surge over the past decade from $13.8 billion in 2015. Sports rights now account for 14% of total U.S. TV revenue. Over the same period, total TV industry revenues grew only 24%, meaning sports rights investment grew five times faster than the broader market. The NBA and MLB’s new media contracts are expected to account for nearly half of a projected $78 billion global sports rights spend.
Viewership and Consumption Trends
U.S. Viewership Statistics (2026)
A January 2026 survey of 1,000 U.S. adults found that 88% of Americans watch live sports, with streaming now the dominant viewing method:
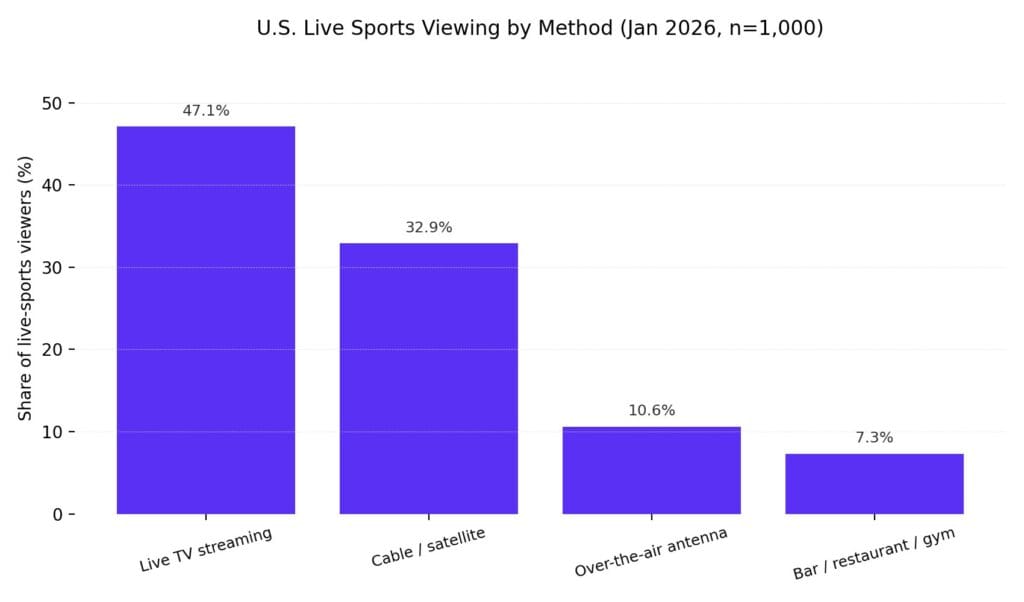
| Viewing Method | Share of Viewers |
| Live TV streaming (Sling, YouTube TV, Hulu Live, etc.) | 47.1% |
| Cable or satellite TV | 32.9% |
| Over-the-air antenna | 10.6% |
| At a bar/restaurant/gym | 7.3% |
Source:
The average American household spends approximately $122.93 per month on live sports—$79.80 for traditional pay TV and $43.14 for standalone sports apps such as ESPN, Peacock, NFL+, and others. Despite streaming’s growing dominance, traditional pay TV remains the largest cost driver.
Digital vs. Traditional TV Growth
Digital live sports audiences grew 8.3% year-over-year in 2025, far outpacing the broader live sports category, which grew just 0.6%. For 2026, digital live sports audiences are projected to grow 5.8%, while overall live sports viewership growth is expected at just 0.4%.
Streaming’s total share of television viewing reached a record 47.5% in December 2025, with YouTube leading individual platform gains (12.9% share) and Netflix at 8%. Meanwhile, broadcast TV’s sports viewing share dropped to 22.9%, and cable fell over 4% year-over-year to 22.2%.
Despite the digital surge, nearly 90% of total sports viewing still occurs on traditional TV or MVPDs, indicating that the shift—while accelerating—still has a long runway ahead.
Most-Followed Sports Leagues in the U.S. (2026)
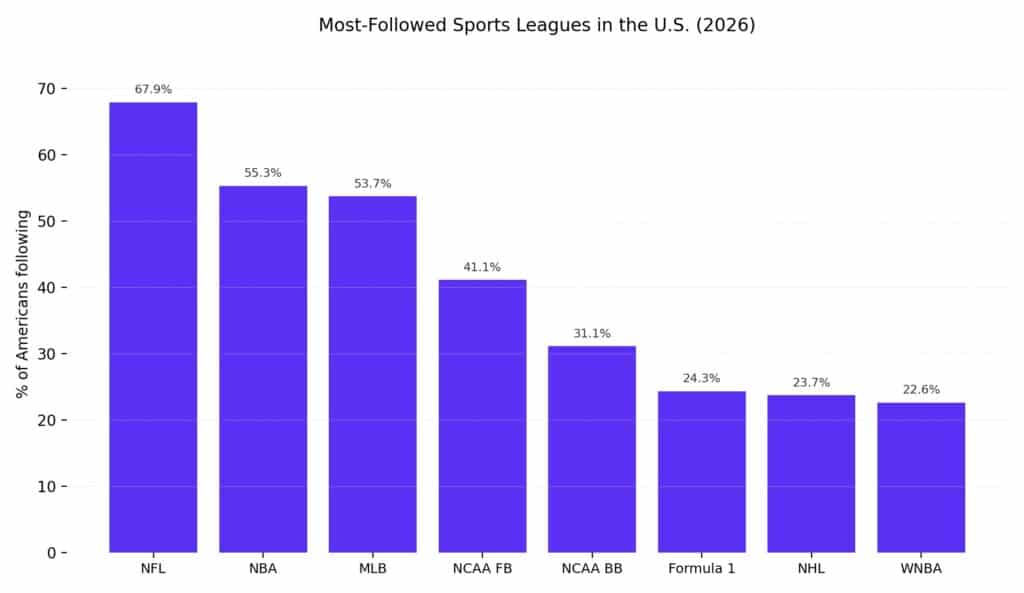
| League | % of Americans Following |
| NFL | 67.9% |
| NBA | 55.3% |
| MLB | 53.7% |
| NCAA College Football | 41.1% |
| NCAA College Basketball | 31.1% |
| Formula 1 | 24.3% |
| NHL | 23.7% |
| WNBA | 22.6% |
Source:
The NFL remains the most-followed league by a wide margin, which explains why NFL rights are the most hotly contested among streaming platforms.
Live Sports as a Subscriber Growth Engine
Sign-Up and Retention Impact
Live sports and event programming emerged as the dominant driver of SVOD growth in the U.S. in 2025. According to Ampere Analysis, live events were responsible for 60% of the most significant sign-up peaks across major platforms including Netflix, Prime Video, Disney+, Hulu, Paramount+, and Max. Sports specifically accounted for 85% of all live-driven sign-ups, with the remainder attributed to award shows.
Key subscriber acquisition moments in 2025:
- Netflix NFL Christmas Day 2025: 430,000 new U.S. subscribers, making it the platform’s third-largest acquisition surge since 2018
- Netflix Jake Paul vs. Mike Tyson (2024): 1.4 million sign-ups—the platform’s largest single live event spike
- Paramount+ Super Bowl (2024): 2.4 million new subscribers on coverage day
- Peacock NFL Wild Card (2024): 2 million subscriptions gained
Notably, 45% of users who signed up for Netflix’s first Christmas GameDay in 2024 remained active one year later, and 10% of churned subscribers returned specifically for the 2025 event. Nearly half of sign-ups during live events came from first-time subscribers, demonstrating live sports’ ability to expand reach in a saturated market.
Ad-Tier Acceleration
Live sports broadcasts also correlate with higher ad-supported tier adoption. During live broadcasts, 75% of new users on Amazon Prime Video and Paramount+, and 50% on Netflix, selected ad-supported tiers. Since live sports typically include advertising across all tiers, these sign-ups generate enhanced monetization opportunities.
Platform Landscape and Content Strategy
Top Platforms by Sports Content Volume
Amazon Prime Video, Disney+, and Netflix together host 92% of all sports programming available on major SVOD services, including live games, sports news, highlight shows, and documentaries. Sports content across the top five global SVOD services (Amazon Prime Video, Apple TV+, Disney+, Netflix, and Paramount+) surged 52% year-over-year as of early 2026, and these providers had increased their collective sports offerings by 72% since the end of 2024.
Platform-Specific Strategies
- Amazon Prime Video: Now the top sports streaming spender globally. Holds exclusive NFL Thursday Night Football, the NBA’s 11-year deal ($1.8B/year), and select UEFA Champions League rights in Europe. These rights provide a year-round live sports portfolio in the U.S.
- YouTube TV: Holds the $2 billion/season NFL Sunday Ticket deal, making it the third-largest streaming spender on sports.
- Netflix: Has invested in NFL Christmas Day games and WWE ($500M/year), driving major subscriber spikes. The platform is reportedly considering a bid for U.S. Formula One rights.
- Apple TV+: Exclusive U.S. home for MLS matches and Friday Night Baseball. Also holds exclusive Formula 1 racing rights in the U.S.
- Peacock: Reached 44 million subscribers in late 2025, though navigating heavy operating losses from high content costs.
- DAZN: Remains a powerhouse in European sports streaming with rights to football in Germany, Italy, Spain, and France.
Top On-Demand Platforms Used for Sports (U.S., 2026)
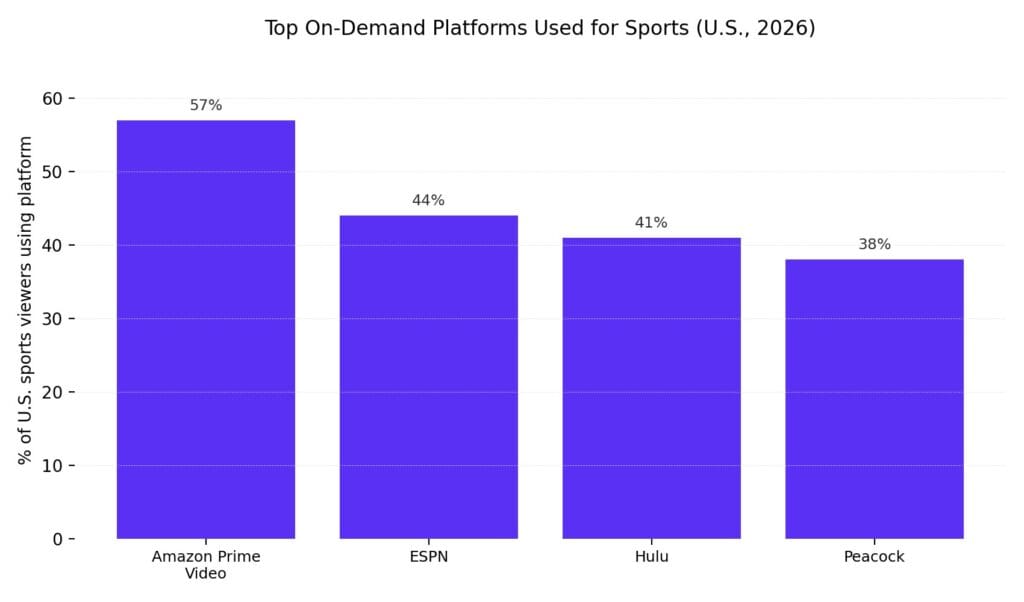
| Platform | % of Sports Viewers Using |
| Amazon Prime Video | 57% |
| ESPN | 44% |
| Hulu | 41% |
| Peacock | 38% |
Source:
A study from Performance Research found that nine in ten sports viewers now use at least one streaming service to watch live games, with 45% reporting they watch live sports more often on streaming than a year ago. The trend is driven primarily by younger audiences (63% of Gen Z, 56% of Millennials), but older demographics are also shifting, with 35% of Gen X and 21% of Boomers increasing their sports streaming time.
Regional Analysis
North America
North America holds the largest share of the global sports streaming platform market, driven by high internet penetration, a strong sports culture, and aggressive cord-cutting trends. U.S. sports rights spending reached $30.5 billion in 2025, with major leagues like the NFL, NBA, and MLB commanding premium rights fees. The region benefits from the presence of all major global streaming platforms and a well-developed advertising ecosystem.
Europe
European sports rights spending is projected to grow from $18.3 billion in 2025 to $21.3 billion by 2030, a 17% increase. However, the growth picture is uneven: the UK has seen sports rights grow at twice the rate of TV revenues since 2015, but France and Germany have seen rights growth largely stall. The region faces significant piracy challenges, particularly in football, which have impacted platform profitability—most notably DAZN’s difficulties in France with Ligue 1.
Asia-Pacific
The Asia-Pacific region is expected to be the fastest-growing market for sports streaming, driven by rapid internet expansion, smartphone penetration, and a massive sports-loving population. Key regional highlights:
- India: Expected to grow at a 13.6% CAGR from 2024 to 2031 for sports streaming and is projected to overtake China in SVOD subscriptions by 2030, reaching an estimated 358 million subscriptions. The Indian Premier League (IPL) remains a key driver, achieving a record 7.5 Television Rating in 2025—a 39% rise from the prior year.
- China: Dominated the Asia-Pacific sports streaming market in 2023, with a projected market value of $6.07 billion by 2031.
- Japan: Registering a 12% CAGR for sports streaming from 2024 to 2031.
- Total Asia-Pacific screen revenues are projected to reach $196 billion by 2030, with online video growing at a 7% CAGR.
Technology Trends Shaping 2026–2033
5G and Ultra-HD Streaming
The rollout of 5G technology is set to revolutionize live sports streaming by enabling higher-resolution broadcasts (4K and 8K) with minimal buffering, supporting real-time interactive features such as multi-angle viewing and enhanced in-stream statistics. SoFi Stadium in Los Angeles, for example, has installed 50 dedicated 5G antennas to serve 70,000+ fans with ultra-low latency connectivity, enabling live multi-angle video streaming and interactive mobile content. At a recent F1 event, Verizon handled 42.9 TB of data over three days.
AI-Powered Personalization
Sports streaming platforms are increasingly leveraging AI and data analytics to offer personalized content recommendations, real-time analytics in live broadcasts, automated camera control, and AI-generated highlight reels. These capabilities enhance user engagement, improve content discovery, and enable more targeted advertising.
AR/VR Immersive Experiences
Augmented reality and virtual reality are emerging as transformative technologies for sports streaming. Trials are underway where fans in select seating sections receive AR glasses or use an AR mode in team apps to view real-time overlays such as first-down lines and player stats. While not yet widespread, venues like Tottenham Hotspur Stadium have 5G infrastructure and edge computing in place to support low-latency AR streaming.
FAST Channels
Free ad-supported streaming television (FAST) is emerging as an additional distribution layer. Hours of live sports content on FAST channels rose 65% year-over-year as of late 2024. Major leagues already have dedicated services on platforms like Tubi, The Roku Channel, and Pluto TV. In February 2025, Fox-owned Tubi TV aired the Super Bowl live, generating 13 million viewers.
Key Challenges
Content Fragmentation and Consumer Fatigue
Platform fragmentation is creating friction for consumers. According to the 2026 Reviews.org survey, 53% of fans reported missing a game they wanted to watch because they didn’t have the right subscription, and 45% said they struggle to find which channel or service a specific game is on. Nearly 75% of respondents agreed that live sports are becoming too expensive to follow their favorite teams.
Piracy
Illegal sports streaming remains a persistent and growing threat. In the UK, illegal sports streaming rose 33% in the first half of 2025, with the top 10 unauthorized sites garnering 1.6 billion views. Approximately 4.7 million people in the UK accessed pirated sports streams during a six-month period ending October 2025. Globally, 10.8 million takedown notices were sent to digital intermediaries in 2024, surging to 26.2 million over 18 months through June 2025—a 142% increase. However, 89% of these notices did not result in the suspension of illegal streams.
Industry leaders have described illicit streaming as “the biggest financial threat ever faced by the sports media industry,” with major tech companies accused of “ambivalence and inertia” in addressing the problem. In France, piracy issues have directly impacted DAZN’s Ligue 1 deal, with DAZN withholding payments citing insufficient anti-piracy efforts.
High Content Costs and Profitability
While live sports drive subscriber growth, the escalating cost of sports rights poses profitability challenges. Platforms like Peacock continue to navigate heavy operating losses despite reaching 44 million subscribers. The tension between subscriber growth and content cost sustainability will be a defining challenge through 2033.
Outlook Through 2033
The live sports streaming market is positioned for sustained double-digit growth through 2033, driven by several converging forces:
- Cord-cutting acceleration: Streaming has already overtaken cable as the primary way Americans watch live sports, and this trend will intensify as younger demographics—who are overwhelmingly digital-first—age into higher-spending demographics.
- Expanding rights portfolios: Streaming platforms are actively pursuing season-long and multi-year rights deals with major leagues worldwide. The NFL, NBA, MLB, UEFA, and FIFA content will continue to anchor platform strategies.
- Ad-supported tier growth: The combination of live sports and ad-supported streaming tiers creates powerful monetization dynamics. Platforms are expected to further invest in sports to maximize advertising revenue.
- Emerging market expansion: Asia-Pacific, led by India and Southeast Asia, will contribute disproportionately to subscriber growth, with India projected to lead global SVOD subscriptions by 2030.
- Technology enablement: 5G, AI personalization, and immersive technologies will enhance the streaming experience, reducing friction and increasing willingness to pay.
However, risks remain. Content fragmentation, rising piracy, escalating rights costs, and consumer subscription fatigue could temper growth if not effectively addressed. The organizations that successfully balance exclusive content acquisition with affordable access and seamless user experiences will define the next era of live sports consumption.