Global streaming content spending is undergoing a structural shift, with streaming platforms surpassing commercial broadcasters as the dominant force in content investment for the first time in 2025. In 2026, global content investment is forecast to reach $255 billion, with streaming platforms alone accounting for $101 billion — crossing the $100 billion threshold for the first time. Looking further out, the broader media streaming market is projected to nearly double from $157 billion in 2025 to $294 billion by 2033, driven by sports rights escalation, ad-supported model expansion, and international content investment. This report compiles key statistics and forecasts across total content spending, platform-level budgets, sports rights, and market projections through 2033.
Global Content Spending Overview
Historical Baseline (2020–2024)
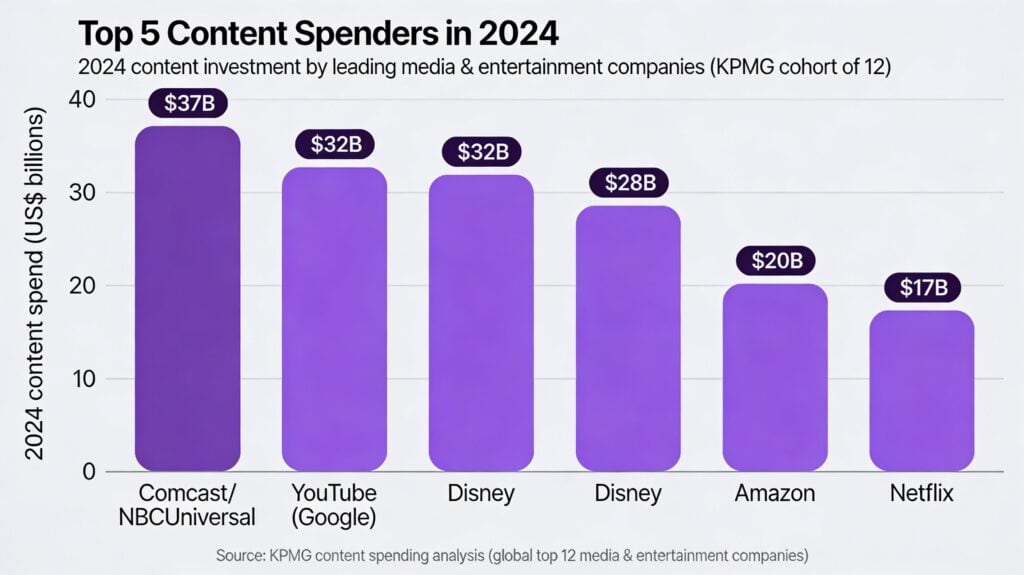
The 12 largest media and entertainment companies collectively spent approximately $210 billion on content in 2024, up 4% year-over-year, according to KPMG. From 2020 to 2024, content spending among this cohort climbed at a 10% compound annual growth rate (CAGR). The top five spenders in 2024 were:
| Rank | Company | 2024 Content Spend |
| 1 | Comcast/NBCUniversal | $37 billion |
| 2 | YouTube (Google) | $32 billion |
| 3 | Disney | $28 billion |
| 4 | Amazon | $20 billion |
| 5 | Netflix | $17 billion |
Source: KPMG analysis
Notably, content spending has not grown uniformly — sports rights have continued to rise, while scripted and reality programming investment has slowed.
2025: Streamers Overtake Broadcasters
Global content spending in 2025 totaled approximately $248 billion, with minimal growth of 0.4% year-over-year. However, within this flat overall market, streaming platforms grew spending 6% to $95 billion, surpassing commercial broadcasters as the leading content investors for the first time in history. Streaming services accounted for 39% of total global content spend in 2025.
2026: Crossing $100 Billion
Global content investment is forecast to reach $255 billion in 2026, a 2% year-over-year increase. Streaming platforms (both ad-funded and subscription-based) are expected to invest $101 billion, representing approximately 40% of total global spend. This makes 2026 the first year streaming platforms cross the $100 billion threshold. Traditional broadcasters — including pay-TV operators, commercial broadcasters, and public broadcasters — are projected to see stagnant or declining investment levels.
Major Platform Content Spending (2024–2026)
Netflix
Netflix’s content spending trajectory remains the industry benchmark:
- 2024: ~$17 billion (actual, including ~$16.2 billion in content amortization)
- 2025: ~$18 billion
- 2026: ~$20 billion (a 10% increase, per Netflix’s Q4 2025 earnings guidance)
Netflix crossed 325 million subscribers in Q4 2025 and projects 2026 revenue between $50.7 billion and $51.7 billion. The company’s ad revenue exceeded $1.5 billion in 2025 and is expected to roughly double in 2026.
Amazon
Amazon’s total content outlay (spanning video and music) climbed 10% to $22.4 billion in 2025. For Prime Video specifically, global programming costs were projected at $10.6 billion in 2025. Amazon’s NFL Thursday Night Football deal alone costs approximately $1 billion per year, and the company’s 11-year NBA partnership — valued at $1.8 billion per season — entered its first full year in 2026.
Disney
Disney expects to spend $24 billion on content in fiscal 2026 (ending September), an increase of $1 billion from $23 billion in fiscal 2025. This budget is split roughly 50-50 between sports (ESPN) and entertainment. CFO Hugh Johnston noted that while spending will continue to grow, it will not return to the peak of $33 billion seen in fiscal 2022, when companies were “overproducing” original content.
Paramount
Following the Skydance merger, Paramount plans incremental programming investments exceeding $1.5 billion in 2026. This budget covers UFC rights ($1.1 billion annual deal), Paramount+ originals, third-party content licensing, and a planned ramp-up to 15 films annually. Paramount+ closed Q3 2025 with 79.1 million subscribers.
Warner Bros. Discovery / HBO Max
While specific 2026 content spend figures for WBD have not been publicly disclosed, HBO Max reached 128 million subscribers by Q3 2025 and is planning international expansion into Germany and Italy in early 2026. WBD’s studios segment is on track to deliver at least $2.4 billion in adjusted EBITDA in 2025, with the 2026 HBO Max content slate described as stronger than 2025’s.
Sports Rights Spending
Sports rights represent the fastest-growing segment of streaming content investment, fundamentally reshaping how platforms compete for audiences.
2026 Sports Rights Forecast
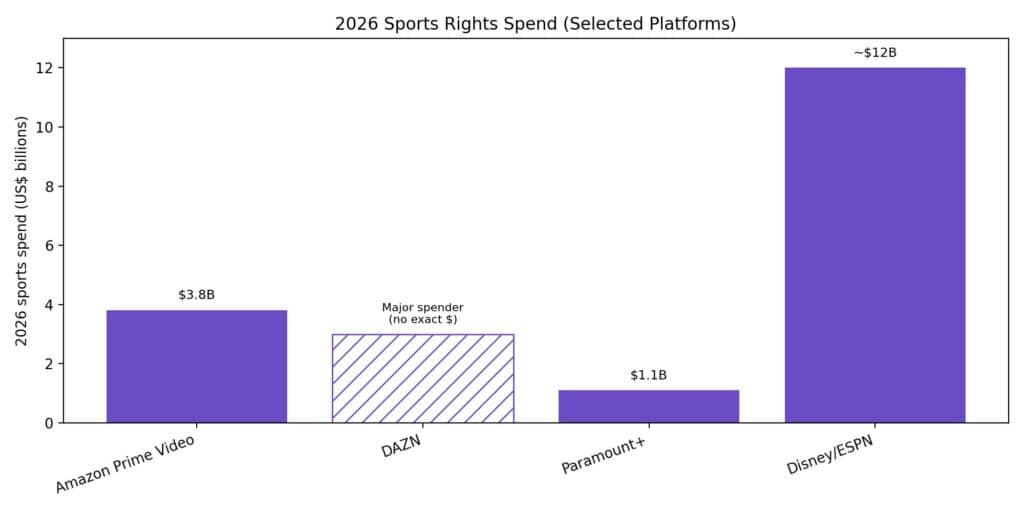
Global streaming services are expected to allocate $14.2 billion to sports rights in 2026, a 7% increase from 2025. Amazon Prime Video is projected to surpass DAZN as the top spender, accounting for 27% of the total global outlay at $3.8 billion.
| Platform | 2026 Sports Spend | Key Rights |
| Amazon Prime Video | $3.8 billion | NBA ($1.8B/season), NFL Thursday Night Football, UEFA Champions League |
| DAZN | Major spender | FIFA Men’s Club World Cup |
| Paramount+ | $1.1 billion/year | Exclusive UFC rights (US) |
| Disney/ESPN | ~$12 billion (sports half of $24B total) | NBA, WNBA, MLB, NFL |
Source: Ampere Analysis; Disney filings
Generalist streaming platforms — those offering movies and series alongside sports — now account for 44% of total sports rights spending, using live sports as a “sticky” content category to acquire and retain subscribers.
Sports Rights Trajectory to 2030
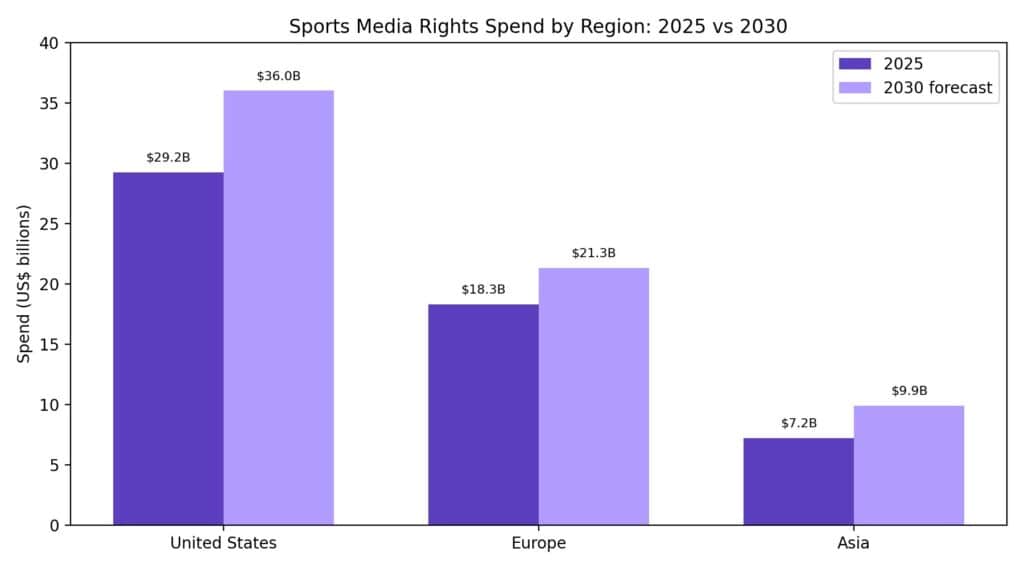
According to Ampere Analysis, global spending on sports media rights is projected to exceed $78 billion by 2030, representing a 20% increase from 2025 levels:
| Region | 2025 Spend | 2030 Forecast | Growth |
| United States | ~$29.25 billion | >$36 billion | ~23% |
| Europe | $18.3 billion | $21.3 billion | 17% |
| Asia | $7.2 billion | $9.9 billion | 38% |
Sources: Ampere Analysis; S&P Global
Key upcoming rights cycles driving this growth include:
- NBA: New rights cycle beginning 2025–26 season, with Amazon’s 11-year deal
- MLB: New broadcast deals from 2029
- NFL: Current deals run to 2034, but the league considers its rights undervalued and may initiate renegotiations as early as 2026
- Indian cricket: New IPL and ICC tournament packages expected to command higher fees from 2027 onwards
- Major events: 2030 FIFA World Cup and Winter Olympics expected to further elevate valuations
US TV and streaming sports media rights alone totaled $29.25 billion in 2025 — over half the global total — up from an estimated $14.64 billion in 2015.
Market Size Forecasts (2026–2033)
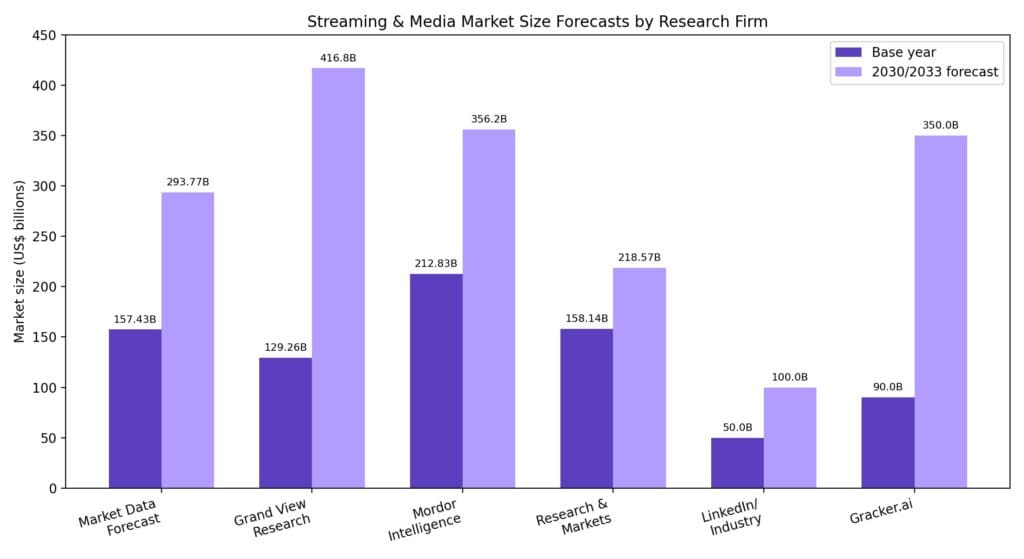
Multiple research firms have published forecasts for the broader streaming and media market. While methodologies and market definitions vary, the consensus points toward sustained growth through 2033.
| Research Firm | Market Definition | 2025/2026 Size | 2030/2033 Forecast | CAGR |
| Market Data Forecast | Media Streaming | $157.43B (2025) | $293.77B (2033) | 8.11% |
| Grand View Research | Video Streaming | $129.26B (2024) | $416.8B (2030) | 21.5% |
| Mordor Intelligence | Video Streaming | $212.83B (2026) | $356.2B (2031) | 10.85% |
| Research & Markets | Media Streaming | $158.14B (2026) | $218.57B (2030) | 8.4% |
| LinkedIn/Industry Report | Streaming Spending | $50B (2024) | $100B (2033) | 8.5% |
| Gracker.ai | Live Streaming | $90B (2024) | $350B (2033) | 14% |
Sources:
U.S. Market Projections
The U.S. OTT market is expected to grow at a CAGR of 5.9%, reaching approximately $112.7 billion by 2029. Subscription VOD revenue in the U.S. grew 18.3% year-over-year in 2024 to $56.1 billion. Free ad-supported streaming (FAST) services are projected to achieve a 13.8% CAGR, reaching $9 billion by 2029.
According to PwC, total consumer spending on combined OTT video and pay TV will grow from $291.3 billion in 2024 to $318.5 billion in 2029.
Global OTT Revenue
Revenue in the global OTT video market is projected to reach $443.29 billion by 2029. OTT video subscription revenues are forecast to climb to $64.12 billion by end of 2026. Global OTT video advertising is set to generate $207.22 billion in 2025, growing to $267.98 billion by 2029.
Key Trends Shaping 2026–2033 Spending
Ad-Supported Models Drive Growth
Ad-supported tiers are projected to account for all SVOD subscription growth in 2026 in the U.S., growing from nearly 363 million subscriptions in 2025 to 376 million in 2026. By 2028, advertising is expected to account for nearly 28% of total streaming revenue, up from 20% in 2023. Global ad spending is predicted to surpass $1 trillion by 2026.
Structural Shift from Broadcast to Streaming
The divergence between global streamers and local broadcasters continues to widen. In the U.S., commercial broadcasters are reducing content spend as studio parent groups redirect budgets toward proprietary streaming services. Outside the U.S., broadcasters show slightly greater resilience but are not experiencing renewed growth — rather maintaining a defensive posture.
Content Strategy Evolution
KPMG’s analysis indicates the industry has not reached “peak content” — but spending patterns are becoming more deliberate. Companies are using data-driven insights to prioritize investments, with emphasis shifting from volume to quality. AI is expected to streamline certain aspects of production, making content creation faster and more cost-effective over time.
International and Local Content Expansion
Major platforms are increasing investment in local content for specific markets. Disney’s CFO noted that while Disney content has global appeal, local content is essential for maintaining engagement and subscriber retention. Netflix’s growing content budget is also partially directed toward international productions.
Bundling and Partnerships
Streaming platforms are increasingly pursuing bundle strategies to reduce churn and increase subscriber acquisition. Notable bundles include the Apple TV and Peacock bundle ($14.99/month) and Comcast’s StreamSaver package combining Netflix, Peacock, and Apple TV+ at over 30% savings.
Outlook: 2027–2033
While granular year-by-year streaming content spending forecasts for 2027–2033 are limited, several structural indicators point to sustained growth:
- Streaming content spending CAGR: Based on the trajectory from $89.6 billion (2024) to $101 billion (2026), streaming-specific content spending is growing at approximately 6% annually. At this rate, streaming content spend could reach approximately $135–145 billion by 2030.
- Sports rights escalation: The 20% growth forecast for global sports media rights through 2030 will be a major spending driver, particularly as NFL renegotiations and new cricket rights packages come into play from 2027 onwards.
- Market expansion: The broader media streaming market is projected to reach $293.77 billion by 2033 at an 8.11% CAGR, while live streaming alone could reach $350 billion by 2033 at a 14% CAGR.
- Advertising revenue: As ad-supported models mature and global ad spend crosses $1 trillion by 2026, platforms will have additional revenue to reinvest in content.
- Content spending discipline: Unlike the “overproduction” era of 2021–2022, platforms are now focused on return-on-investment metrics, meaning spending growth will be more measured but sustained.
The period from 2026 to 2033 will likely see streaming platforms consolidate their dominance over the global content landscape, with total streaming content investment potentially exceeding $150 billion annually by the end of the decade, driven by sports rights, international expansion, and the maturation of ad-supported business models.