The average U.S. household pays for approximately 4 to 6 streaming services, depending on the research methodology and what counts as a “subscription.” The most widely cited figures place the number at 5.1 paid subscriptions per household according to BB Media’s 2025 study, while broader definitions that include free ad-supported services push the number as high as 6.9 per household according to Comscore. As of late 2025, 91% of U.S. internet households subscribe to at least one streaming service, and households spend an average of $52 to $109 per month on streaming, depending on the number and type of services.
Average Subscription Counts by Research Source
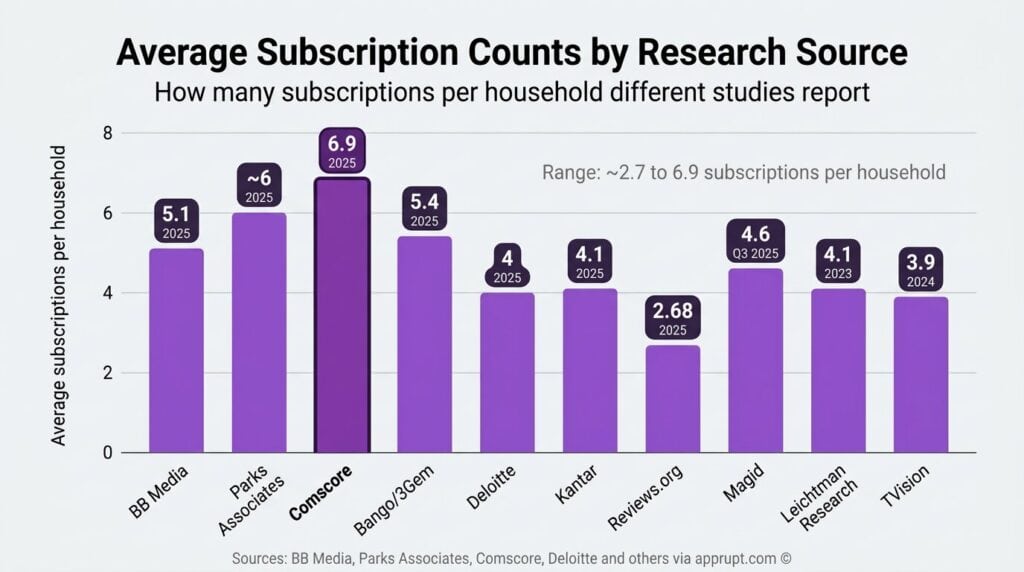
Different research firms arrive at varying numbers based on what they include (paid-only vs. ad-supported), who they survey, and how they define a “subscription.” The table below summarizes the most prominent estimates:
| Research Firm | Average Subscriptions Per Household | Year | Notes |
| BB Media (via CTAM) | 5.1 | 2025 | Paid subscriptions; U.S. ranked second globally after India |
| Parks Associates | ~6 | 2025 | Video services; includes hybrid monetization models |
| Comscore | 6.9 | 2025 | Includes ad-supported and free services |
| Bango/3Gem | 5.4 | 2025 | Includes 2 bundled subscriptions per household on average |
| Deloitte | 4 | 2025 | SVOD services only |
| Kantar | 4.1 | 2025 | Paid streaming services |
| Reviews.org | 2.68 | 2025 | Paid services; lower-end estimate from consumer survey |
| Magid | 4.6 | Q3 2025 | Up from 4.1 a year prior |
| Leichtman Research | 4.1 | 2023 | SVOD and DTC services; 5.1 for ages 18–44 |
| TVision | 3.9 | 2024 | Actively used streaming apps per CTV household |
The consensus across these sources points to a range of 4 to 6 paid services for the typical U.S. household. The variation reflects definitional differences: studies counting only paid SVOD subscriptions tend to land around 4–5, while those including free ad-supported streaming television (FAST) platforms like Tubi, Pluto TV, and the Roku Channel report higher numbers.
Household Penetration and Adoption
Streaming has become a near-universal utility in American homes:
- 91% of U.S. internet households subscribe to at least one streaming service, according to Parks Associates’ 2025 State of Streaming report.
- 88% of all U.S. households have at least one video streaming subscription when including non-internet homes.
- 53% of households have four or more streaming subscriptions.
- Traditional pay-TV has fallen to just 41% penetration, a 50-percentage-point gap behind streaming adoption.
- By late 2025, streaming captured 44.8% of all U.S. TV viewing time, eclipsing the combined share of broadcast (20.1%) and cable (24.1%) for the first time.
Connected TV streaming reached 96.4 million U.S. households in 2025, with households streaming nearly 5 hours per day on average.
Monthly Spending on Streaming
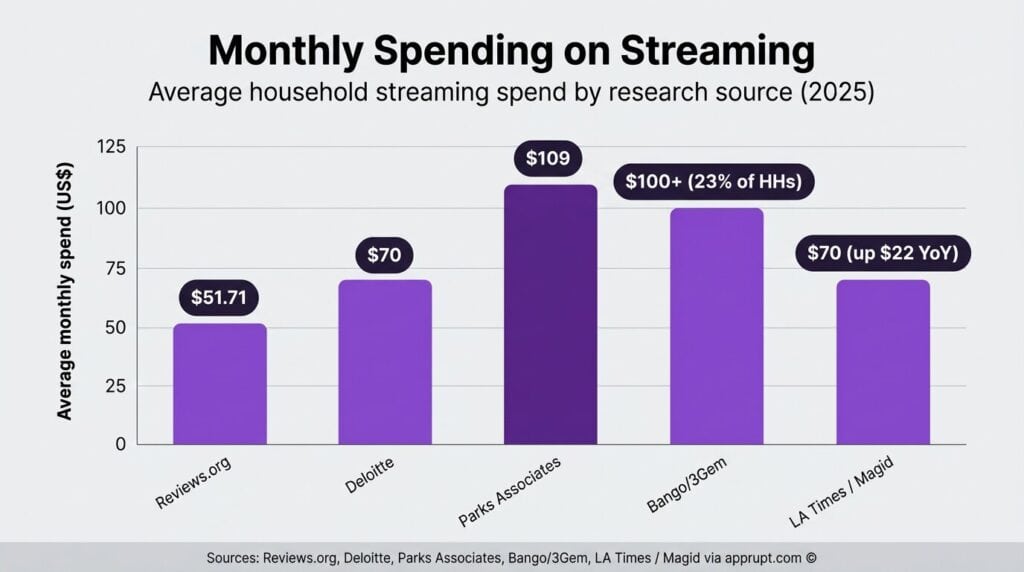
How much households spend varies significantly based on the number of subscriptions, whether they choose ad-supported or ad-free tiers, and whether bundled services are included:
| Source | Average Monthly Spend | Year |
| Reviews.org | $51.71/month | 2025 |
| Deloitte | $70/month | 2025 |
| Parks Associates | $109/month | 2025 |
| Bango/3Gem | $100+ for 23% of households | 2025 |
| LA Times / Magid | $70/month (up $22 YoY) | 2025 |
The spending increase has been sharp. Reviews.org found an 18% year-over-year jump from $42.38/month in 2024 to $51.71 in 2025. Subscription prices across major platforms have risen by an average of 25% in the past year, with individual services increasing rates by about 9% annually. Many households now spend as much or more on streaming as they previously paid for cable television.
Demographics of Streaming Subscribers
Subscription counts vary significantly by age, income, and household composition:
By Age Group
- 18–29: Highest adoption (95%+), most likely to have 5+ subscriptions
- 30–44: High adoption (90%+), 4–5 subscriptions on average
- 45–64: Strong adoption (80%+), 3–4 subscriptions
- 65+: Growing adoption (60%+), 2–3 subscriptions
By Income
- Households earning $100,000+ annually average 5–6 subscriptions
- Lower-income households are more likely to rely on free ad-supported services
- Ad-supported tiers are growing across all income levels
By Household Composition
- Families with children: Highest counts at 5–7 services
- Young singles: 3–4 services
- Empty nesters: 3–4 services
- Seniors: 2–3 services
The Bundling and Stacking Trend
A major factor behind the high subscription counts is the rise of bundling. According to Bango’s January 2025 research, two of the average 5.4 subscriptions come as part of a bundled package. About 55% of these bundles are “indirect” subscriptions through mobile carriers like T-Mobile, Verizon, and AT&T, while 34% come through retail bundles like Walmart+ and Amazon Prime.
The typical streaming household builds a “stack” that includes:
- One major general entertainment service (Netflix or Amazon Prime Video)
- One Disney/family-focused service (Disney+, Disney Bundle)
- One news or live sports option (Peacock, Paramount+)
- One or more free ad-supported services (Tubi, Pluto TV)
This approach mirrors the old cable bundle, but assembled à la carte across platforms. Notably, 62% of subscribers say they would prefer a single bundle over signing up for individual services, and 41% are annoyed they can’t manage all subscriptions in one place.
Subscription Fatigue and Churn
Despite growing subscription counts, consumers are increasingly frustrated. The monthly churn rate for streaming services jumped from 2% in 2019 to 5.5% by early 2025. Key indicators of subscriber fatigue include:
- 62% of subscribers say there are “too many” streaming services.
- 23% of the U.S. streaming audience are now “serial churners” — users who cancel three or more services within two years.
- 45% of users cite high costs as the primary reason for cancellation.
- Among Gen Z subscribers, 37% have canceled at least one service due to subscription fatigue since December 2025, with another 29% planning to do so soon.
- 8 in 10 Gen Z streamers have signed up for a service to watch a specific show, then canceled or paused it within the past year.
- The percentage of streamers with four or more subscriptions dropped from 23% in 2024 to 21% in 2025, signaling a potential plateau.
Consumers also spend an average of 14 minutes per session searching for content, and 49% are willing to cancel if finding something to watch takes too long.
Global Context
Streaming subscription patterns vary by country. The 2025 BB Media study found the U.S. averages 5.1 subscriptions per household, ranking second globally behind India. A 2024 global study by Statista found the U.S. led on a per-user basis with 3.6 paid subscriptions, compared to 2.1 in Japan.
India’s OTT market is surging, with an audience of 601.2 million and 148.2 million active paid subscriptions. SVoD spending in India rose 11% in 2024 to INR 100.6 billion, driven by the JioHotstar consolidation, aggressive pricing, and local-language content. JioHotstar alone had an estimated 300 million paying subscribers in India in 2025.
The global media streaming market is valued at approximately $108.73 billion in 2025 and is projected to reach $193.84 billion by 2032, growing at an 8.6% CAGR. North America holds 46.6% of the global market share, while Asia Pacific is the fastest-growing region at 38.7%.
Most Popular Streaming Services in the U.S.
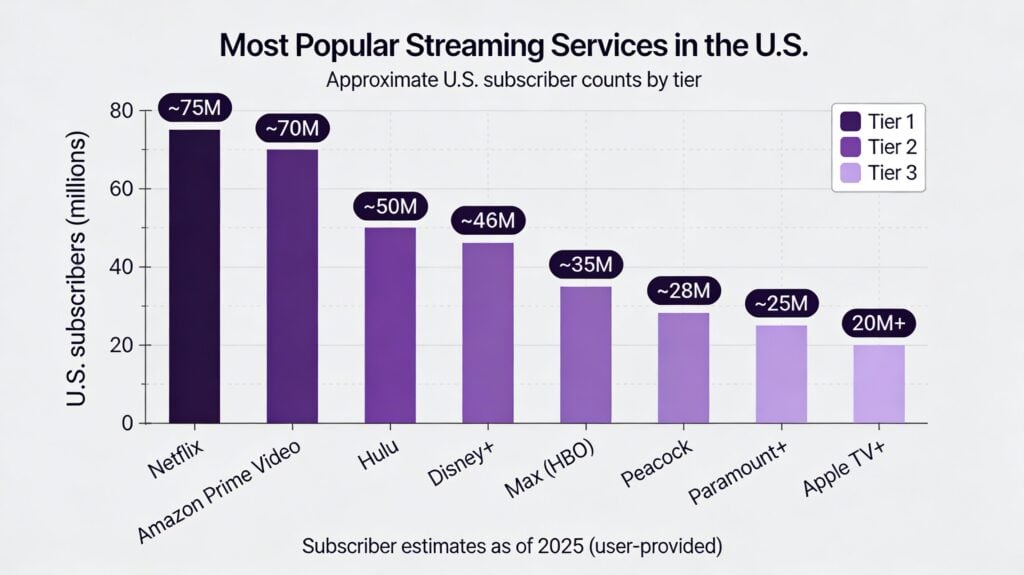
Netflix and Amazon Prime Video remain the dominant platforms by subscriber count:
| Tier | Platform | U.S. Subscribers (Approx.) |
| Tier 1 | Netflix | ~75 million |
| Tier 1 | Amazon Prime Video | ~70 million |
| Tier 2 | Hulu | ~50 million |
| Tier 2 | Disney+ | ~46 million |
| Tier 2 | Max (HBO) | ~35 million |
| Tier 3 | Peacock | ~28 million |
| Tier 3 | Paramount+ | ~25 million |
| Tier 3 | Apple TV+ | ~20+ million |
Free ad-supported platforms like Tubi, Pluto TV, and the Roku Channel each exceed 80 million monthly active users, making them major players in the broader streaming ecosystem even though they don’t require paid subscriptions.
Netflix’s ad-supported tier now accounts for 45% of total household viewing hours, up from 34% in 2024, reflecting a major consumer shift toward affordability.
Streaming vs. Cable: The Crossover
The shift from cable to streaming is now definitive. In May 2025, streaming reached 44.8% of all TV viewing, surpassing the combined share of broadcast and cable for the first time. On Christmas Day 2025, streaming captured 54% of daily TV viewing with a record 55.1 billion viewing minutes.
Cable subscribers have dropped to 68.7 million households in 2025, down from 105 million in 2010 — a 35% decline over 15 years. By late 2025, only 36% of U.S. households had a traditional TV subscription, down from over 50% in mid-2022. Forecasts suggest just 21% of households will retain traditional TV subscriptions by the end of 2028.
Cable customers still pay an average of $101–$147/month for TV packages, compared to the $52–$70/month average for streaming. However, as streaming prices rise and households stack more services, the cost gap is narrowing.
Conclusion
The average U.S. household pays for roughly 4 to 6 streaming subscriptions, with the most commonly cited figure at 5.1 services as of 2025. This number has steadily increased over the past several years, driven by exclusive content, bundling through carriers, and the fragmentation of programming across platforms. Households now spend between $52 and $109 per month on streaming depending on their subscription mix, approaching or exceeding what many once paid for cable. However, rising churn rates and subscription fatigue — particularly among younger consumers — suggest the market may be approaching a saturation point, with re-bundling and ad-supported tiers emerging as the industry’s response to consumer pushback.